Kingston NV3 PCIe 4.0 NVMe SSD 2TB Unboxing Review

The Kingston NV3 PCIe 4.0 NVMe SSD uses the SMI SM2268XT PCIE Gen4 x4 controller chip and delivers sequential read/write performance of up to 6,000 and 5,000 MB/s, with capacities of 500GB, 1TB, 2TB, and 4TB to choose from, and a single-sided cell layout that is compatible with a wide range of platforms for expansion. With Acronis backup software and a three-year limited warranty, can the NV2 take on the burden of its predecessor and continue to be the price-performance SSD of choice after improving read/write performance?
Kingston NV3 PCIe 4.0 NVMe SSD 2TB Solid State DriveSpecifications:
Interface: PCI-Express 4.0 x4
NVMe: 1.4
Interface format: M.2 2280
Continuous read speed: 6000 MB/s
Continuous Write Speed: 5000 MB/s
Capacity Options: 500GB / 1TB / 2TB / 4TB
Controller: SiliconMotion(SMI) SM2268XT
NAND Flash: Toshiba Toshiba 162L QLC cells
Cache: Host Memory Buffer (HMB) Technology
Dimensions: 80 x 22 x 2.3 mm
Warranty: 3-year limited warranty
TBW Durability: 640 TB
A New Choice for Gaming Disk Expansion Kingston NV3 PCIe 4.0 NVMe SSD Unboxing
After a previous unboxing test of the high-endFURY Renegade PCIe 4.0 NVMe M.2 SSD 2TBThere are also mainstream levels ofKC3000 PCIe 4.0 NVMe M.2 SSDsAfter the launch of Kingston NV2, I wanted to unbox and test the NV2, but I heard that the new NV2 will be launched soon at COMPUTEX 2024, so I didn't have to wait for the NV2 any longer. I have to say, I personally like Kingston's simple and easy to categorize product lineup, because I don't have to remember a lot of models.
The NV3 PCIe 4.0 NVMe SSDs in this unboxing test are available in 500GB, 1TB, 2TB, and 4TB capacities, with sequential read/write speeds of up to 6,000 and 5,000 MB/s, although the speeds are not comparable. FURY Renegade PCIe 4.0 NVMe M.2 SSD 2TB 和 KC3000 PCIe 4.0 NVMe M.2 SSDsThe NV2's performance is still much better than the 3500 and 2800 MB/s of the previous generation of NV2s, but the NV2's performance is still much better than the previous generation of NV2s.
At the time of writing, the price difference between the NV3 and NV2 2TB models is around NT$500 to NT$600, but the NV2 is supposed to be replaced by the EOL, so it should be a clearing price recently? Considering the increase in read/write performance, it's up to you to pinch the price difference a bit more.

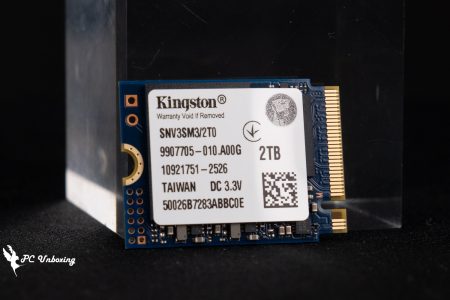
∆ Kingston NV3 PCIe 4.0 NVMe SSD 2TB SSD.
Since the NV3 is a price-performance model, most people will choose this product for expansion or gaming, so this M.2 SSD does not use thin graphene aluminum alloy thermal pads like the other two higher-positioned models, but simply a black and white label.
Of course, there are no aluminum heat sinks included, so it's compatible with PCs, laptops, mini-systems, and other platforms with limited installation space.
The 2TB version comes with a three-year limited warranty, and the total TBW (Tera Bytes Written) is 640 TB, which translates to 2048 GB (2 TB), and the DWPD_Drive Writes Per Day (DWPD_Drive Writes Per Day) would have to be 584 GB per day for three years before exceeding the nominal TBW value. value.

∆ NV3 has only a label sticker on the front.

∆ Single-sided particle layout.
After removing the sticker, you can see that the NV3 uses SiliconMotion's (SMI) SM2268XT2G AA controllers, which are powered by a dual-core ARM Cortex R8 CPU and support four NAND channels up to 3,200 MT/s each.
Equipped with Huilon's new 8th generation NANDXtend ECC technology, it combines the 4K+ LDPC ECC engine and RAID function to provide better error correction capability, while the cache function is provided by the system DRAM through the 64MB Host Memory Buffer (HMB), and there is no DRAM cache on the body itself. There is no DRAM cache, which is the so-called DRAM less program.
The 3D NAND Flash die has Kingston FP01T08UCT1-6B printed on it, and when viewed through the SSD utils software you can see that it's a Toshiba 162L QLC die, so should I change my name to CAYAN (Kioxia) or WD? As for whether to change the name to Kioxia or WD, I'll just write whatever the software says.

∆ Kingston NV3 master with particle view.

∆ Using SiliconMotion(SMI) SM2268XT host controller.

Kingston FP01T08UCT1-6B is printed on the ∆ NAND Flash die.

∆ The Kingston NV3 that I have is using Toshiba 162L QLC chips with 64 MB HMB capacity.
Kingston NV3 PCIe 4.0 NVMe SSD 2TB Solid State Drive Performance Testing

The test platform uses an AMD Ryzen 9 7900 processor with a GIGABYTE B650I AORUS ULTRA motherboard and a Kingston NV3 PCIe 4.0 NVMe SSD 2TB installed in the first slot of the motherboard, M2B_CPU, which provides full PCIE Gen5 x4 bandwidth for performance measurements from the processor's direct connect channel. This slot provides full PCIE Gen5 x4 bandwidth from the processor's direct connection to the motherboard for performance testing. However, since the test drives are running PCIE Gen4 x4, the frequency of the slot will be lowered automatically, and we remind you that the test performance may vary depending on the firmware version of the SSDs, the hardware configuration of the system, and other factors, so the results are only provided as a reference.
Testing Platform
Processor: AMD Ryzen 9 7900 (PBO AUTO)
Cooler: AMD Wraith Prism
Motherboard: GIGABYTE B650I AORUS ULTRA (BIOS Version: F32b)
Memory:G.SKILL Trident Z5 Neo RGB DDR5 6400 MT/s 32GB (2x16GB)
Display card:MSI GeForce GTX 1080 SEA HAWK X
Operating System: Windows 11 Professional 23H2
System Drive: Kingston A2000 NVMe PCIe SSD 500GB
Test Drive: Kingston NV3 PCIe 4.0 NVMe SSD 2TB (formatted empty)
Power supply:FSP Hydro PTM PRO ATX3.0 (PCIe5.0) 1200W
Case: STREACOM BC1 Benchtable V2
Graphics Card Driver: GeForce Game Ready 555.99
The first step is to check the basic information of the Kingston NV3 PCIe 4.0 NVMe SSD 2TB via CrystalDiskInfo software. It adopts the PCIe 4.0 x4 transfer mode and NVM Express 1.4 standard, and the supported features include S.M.A.R.T. (Self-Monitoring, Analyzing, and Reporting Technology), TRIM, and VolatileWriteCache. VolatileWriteCache. The firmware version tested by the author is SDQ00103.

∆ formatted and converted to different bit system units can use 1.81 TB.

∆ CrystalDiskInfo software view information.
Use on an empty disk CrystalDiskMark The software was used to test the read/write performance of the Kingston NV3 PCIe 4.0 NVMe SSD 2TB. The test file size was set to 1GiB in NVMe SSD configuration mode, and the sequential read/write speeds measured in the default profile were 6235MB/s and 5586MB/s. The software was also used to test the performance of the Kingston NV3 PCIe 4.0 NVMe SSD 2TB.
The Q8T1 test result in the first column represents a thread with eight queue depths, which means that there are eight 1MB-sized accesses in the worklist waiting to be accessed. This corresponds to a real situation, such as reading or writing eight 1MB files from or to a hard disk at the same time, which is generally less likely to be done in general.
The Random Access Default Item RND4K Q32T16 has a random read/write performance of 4005 MB/s and 4074 MB/s.
The RND4K Q32T16 operates with 16 queue depths out of 32 threads, and the file types are random access 4 KB size files written or read into the SSD.

∆ CrystalDiskMark Settings:NVMe SSD / Profile:Default, Sequential Read/Write and Random Read/Write test scores.
For daily use or for gamers, the QD1 to QD4 range is a good reference. If we switch the CrystalDiskMark profile to real-world performance, the first column will be Q1T1. Although the result will be a bit lower than the Q8T1, it will be more in line with the actual performance of the daily use experience.
The reason for this is that most of the daily operating systems use Q1T1, which is a queue-depth mode with one thread, so Q1T1 is more suitable for daily use than Q8T1. The read/write speeds are 3633 MB/s and 4968 MB/s in Q1T1 mode with the capacity of the test file set to 1GiB.

∆ CrystalDiskMark Settings:NVMe SSD / Profile:Real World Mode 1GiB profile test results.
follow ATTO Disk Benchmark To test the continuous read/write performance and stability of different file sizes, the maximum value is 5.34 GB/s for writing and 5.85 GB/s for reading.

∆ ATTO Disk Benchmark.
Professional video multimedia file write and read performance testing using the AJA System Test To simulate the scenario test, the test was set to 5120×2700 5K RED format for 64GB and 1GB files, and the Codec Type was 10bit YUV by default, the final results were 5069 MB/s write and 5484 MB/s read for 1GB mode, and 5202 MB/s write and 5440 MB/s read for 64GB mode.

∆ AJA System Test 1GB.

∆ AJA System Test 64GB.
Next, through TxBENCH The test was conducted in the default test file 512MB mode, and obtained a read of 6082 MB/s and a write of 5589 MB/s. The test was conducted in the default test file 512MB mode, and obtained a read of 6082 MB/s and a write of 5589 MB/s.

∆ TxBENCH Default test file 512MB mode results.
3DMark The storage benchmark test is conducted by game startup loading, copying game files, game archiving, installing games, and OBS game recording. The scenario mainly uses a number of games to conduct the actual test, so that gamers can clearly refer to the performance of the hard disk in the use of the game, and the above test is recorded in terms of time units, but the final results are calculated using the bandwidth and the average access time. The higher the score, the better.

∆ 3DMark Storage Benchmark Test.
以 PCMARK 10 To test the performance of the three types of storage, the Full System Drive Benchmark uses a series of everyday applications and software, including Windows 10, Adobe series software, game launchers, Microsoft clerical software and related applications, to test the performance of hard disk drives in real-world usage scenarios. The bandwidth of 458.52 MB/s was obtained with an average access time of 57 µs and a total test score of 2904.
Data Drive Benchmark (Data Drive Benchmark), the main test object for data disks used for storing documents, can also be used to test NAS, UFD, and memory cards and other related types of storage devices, in this test, 339 JPEG files (a total of 2.37 GB) will be copied to the SSD, and then create a copy of these JPEG files, and finally copy 2.37 GB of JPEG files to another hard disk to complete the entire write-read-read three-step test, the results in this test are the bandwidth of 2.37 GB JPEG files. In this test, 339 JPEG files (totaling 2.37 GB) were copied to the SSD, then copies of these JPEG files were made, and finally 2.37 GB of JPEG files were copied to another hard drive, completing the entire write-read-write-read three-step test, which resulted in a bandwidth of 639.88 MB/s, an average access time of 36 µs, and a final total test score of 4317 points.

∆ PCMARK 10 Full System Drive Benchmark.

∆ PCMARK 10 Data Drive Benchmark.
Finally, AIDA64 was used to conduct the Read Test Suite, Linear Read, and Linear Write tests. The Read Test Suite mainly uses Linear Read, Random Read, and Buffered Read to test the read performance of the hard disk through these three read methods.

∆ AIDA64 Read Test Suite reads the performance combination test.
AIDA64's Linear Read and Linear Write full disk read/write tests will read/write the hard disk's MAX capacity large files for users to observe its read/write stability. In the Linear Read test, the hard disk mostly stays stable at an average of 6240.6 MB/s until the end of the test, with three small speed drops in the middle of the test.
In the Linear Write test, after exhausting the cache at about 28 %, the write speed dropped to about 213.9 MB/s until the end of the test, and the overall write speed averaged 1529.5 MB/s, which means that unless the user writes a large file of more than 573.44 GB at one time, he/she can enjoy the high speed performance of about 4928.9 MB/s for writing continuously. 4928.9 MB/s performance.

∆ AIDA64 Linear Read.

∆ AIDA64 Linear Write.
During this test, the author used the bare strips directly with the GIGABYTE B650I AORUS ULTRA motherboard's original third-generation cooling armor supplemented by an active cooling fan, and the fan speed curve was kept at the preset "standard" mode of operation, and the maximum temperature of the hard disk after passing all the test items was recorded through the HWinfo64 software, and two temperature sensors could be read from HWinfo64. Two temperature sensors can be read in HWinfo64, and the maximum temperature of the drive was 48°C.
As is Kingston's custom, disk temperature 3 should be the highest temperature recorded in the life of the SSD.

∆ HWinfo64 Temperature Sensor View.
Conclusion
The Kingston NV3 PCIe 4.0 NVMe SSD 2TB SSD was tested out of the box, using SiliconMotion (SMI) SM2268XT controller with Toshiba 162L QLC chips and 64MB HMB (Host Memory Buffer) cache, which is a DRAM less solution. Using the 64MB HMB (Host Memory Buffer) cache, the DRAM less program, the continuous read/write performance can reach over 6000 and 5000 MB/s in real test.
This SSD is positioned as a price-performance product with a relatively cheap price, although the hardware and other specifications are not as high as those of high-end and mainstream products. FURY Renegade PCIe 4.0 NVMe M.2 SSD 2TB 和 KC3000 PCIe 4.0 NVMe M.2 SSDs The NV3 is so good, but through a cheaper price, consumers who need to expand their game storage or file backup capacity will have a new choice. However, after seeing the low price of the NV2 in the past, it seems that the NV3's price is still a little bit more expensive than other competitors in the same class, so I would suggest that Kingston can lower the price of the NV3 a little bit more in order to make the consumers more excited! Of course, I know it's a bit too much to ask for a good price at the early stage of launch, haha.
With a three-year limited warranty and 640 TB of Tera Bytes Written (TBW), there is a big difference between the other two models, especially in the three-year part, and the DWPD_Drive Writes Per Day (DWPD_DWPD) translates to 584 GB of TBW per day for three years to exceed the nominal TBW value. It's not too much to ask for.
The author knows that after this article is published, some people will definitely pass on DRAM less and QLC, but considering the price and product positioning, what more do you want from a Ferrari? If you want DRAM Cache and TLC particles, just squeeze a little more from your budget and go straight to the top! FURY Renegade PCIe 4.0 NVMe M.2 SSD 2TB 和 KC3000 PCIe 4.0 NVMe M.2 SSDsIt's impossible to keep the cost low and the hardware specs perfect, no matter how you think about it.
Yun
Drinks with less than full sugar are colored water. Crossing Turbid Creek, full sugar is not a crime!