AMD Ryzen 9 9950X3D2 Dual Edition Review: Dual 3D V-Cache Performance Measurements, Game Scores and Power Analysis
The world's first processor with dual AMD 3D V-Cache technology, AMD Ryzen 9 9950X3D2 Dual Edition, also known as R9 9950X3D2, features 16 cores, 32 threads, and 192 MB of L3 cache. This specification is considered to be the ultimate answer to the Zen 5, but a higher price and power consumption are the details that need to be considered. This time it will be announced in the ASRock X870E Taichi OCF The motherboard was tested with the RTX 4080 and also included the AMD Ryzen 9 9950X3D 和 Intel Core Ultra 9 285K Two consumer flagship processors are compared for professional scores and gaming performance.
AMD Ryzen 9 9950X3D2 Dual Edition Unboxing and Specs (Dual 3D V-Cache Architecture Explained)
AMD launched the Granite Ridge Zen 5 architecture last year with the 2nd Gen AMD V-Cache design. Ryzen 9 9950X3D 和 AMD Ryzen 9 9900X3D processor, but the use of sometimes according to the software or system scheduling problems, so that the use of the process may not be loaded on the CCD with 3D V-Cache above, and the world's first dual AMD 3D V-Cache technology processor AMD Ryzen 9 9950X3D2 Dual Edition (R9 9950X3D2), directly the two CCDs are put on the 3D V-Cache, so there will be no scheduling problems! The AMD Ryzen 9 9950X3D2 Dual Edition (R9 9950X3D2), the first processor in the world to use dual AMD 3D V-Cache technology, directly puts both CCDs on the 3D V-Cache, so there's no problem of not being able to use it for dispatch!
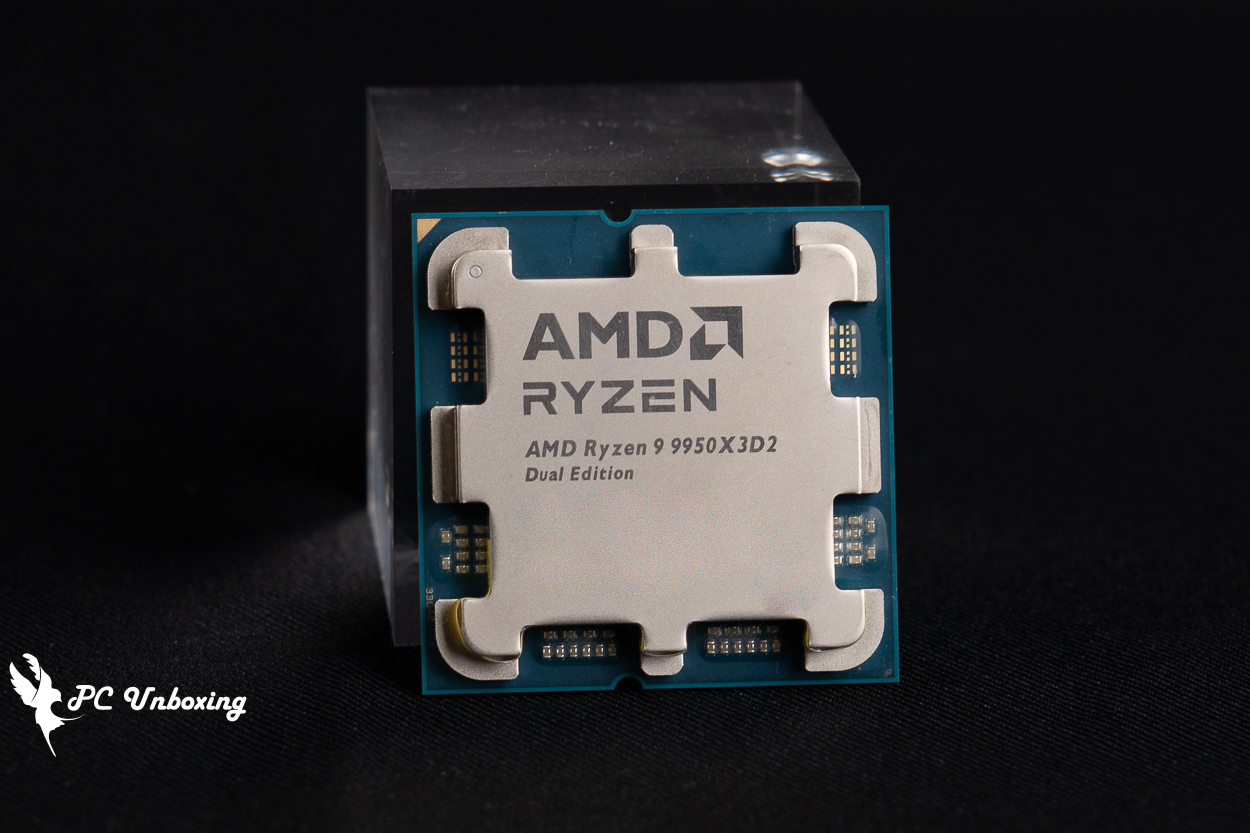
The latest consumer flagship Ryzen 9 9950X3D2 Dual Edition is a 16-core, 32-threaded specification with L3 cache of 192 MB, L2 cache of 16 MB, TSMC 4nm FinFET process, I/O Die is TSMC 6nm FinFET process, and the maximum operating temperature (Tjmax) is 95°C. The maximum frequency is 5.6 GHz. The maximum operating temperature (Tjmax) is 95° C. The maximum frequency is 5.6 GHz.
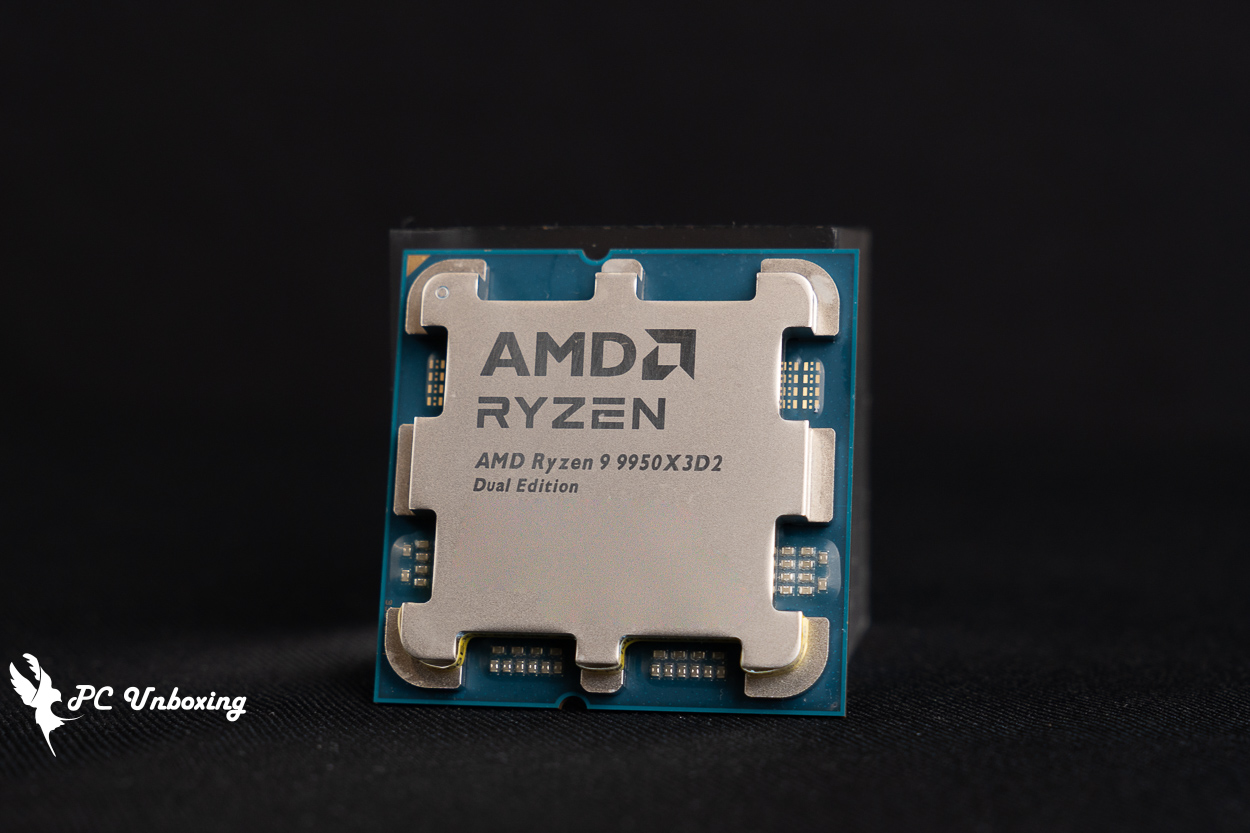
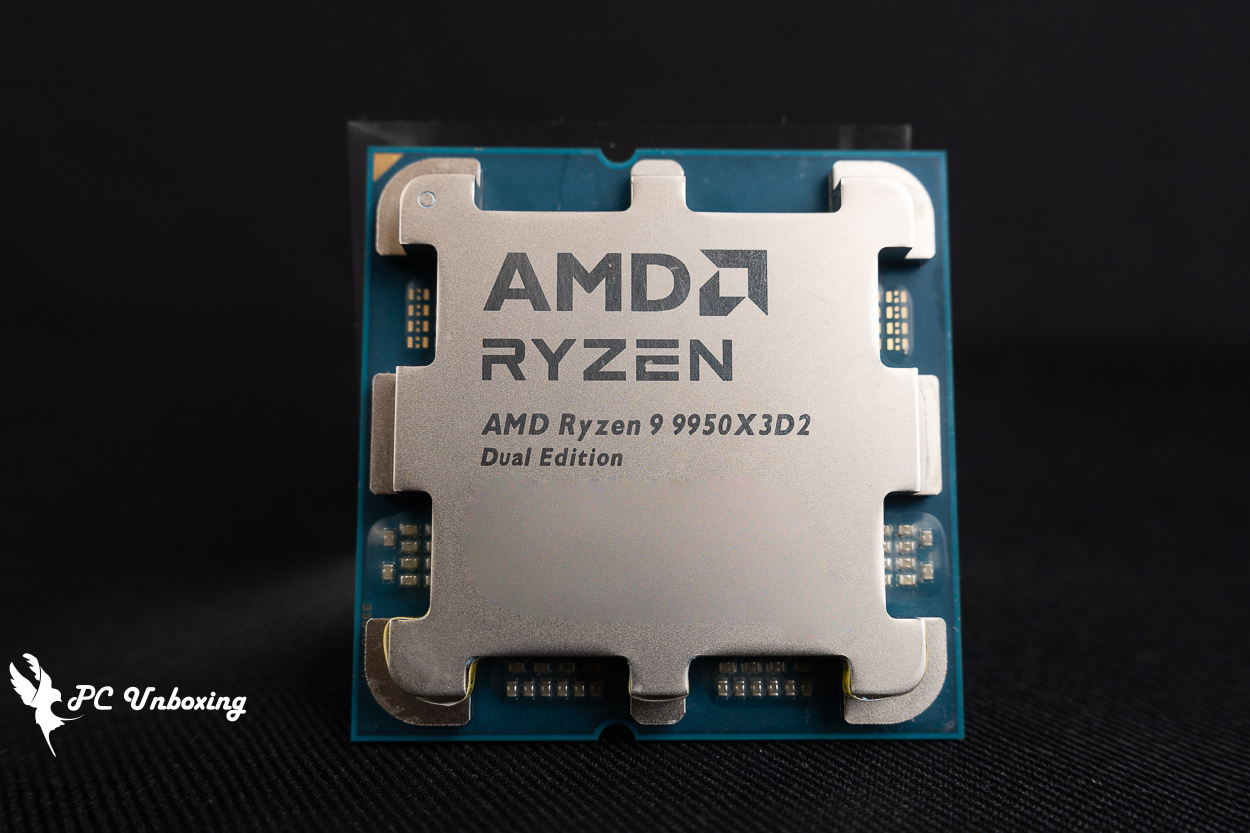
△ AMD Ryzen 9 9950X3D2 Dual Edition, AMD AM5 LGA1718 Pin, Compatible with A620, X670E, X670, B650E, B650, X870E, X870, B840, B850 chipset motherboards.
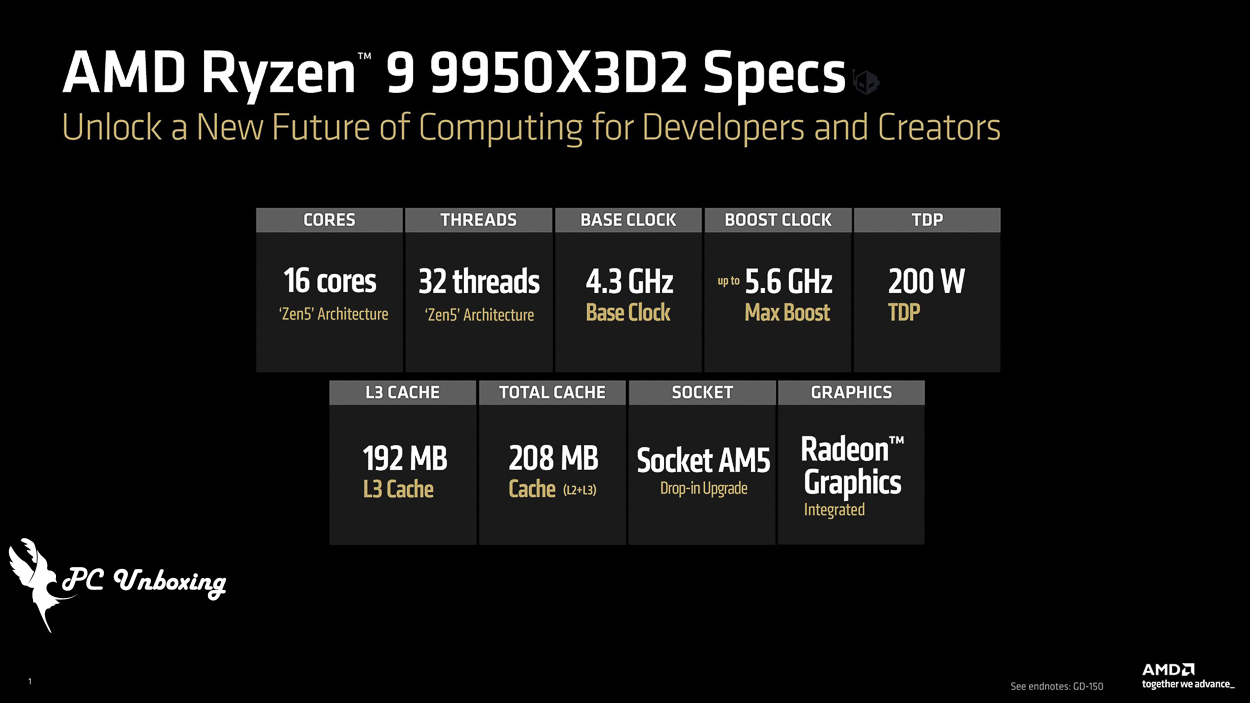
△ AMD Ryzen 9 9950X3D2 Specification.
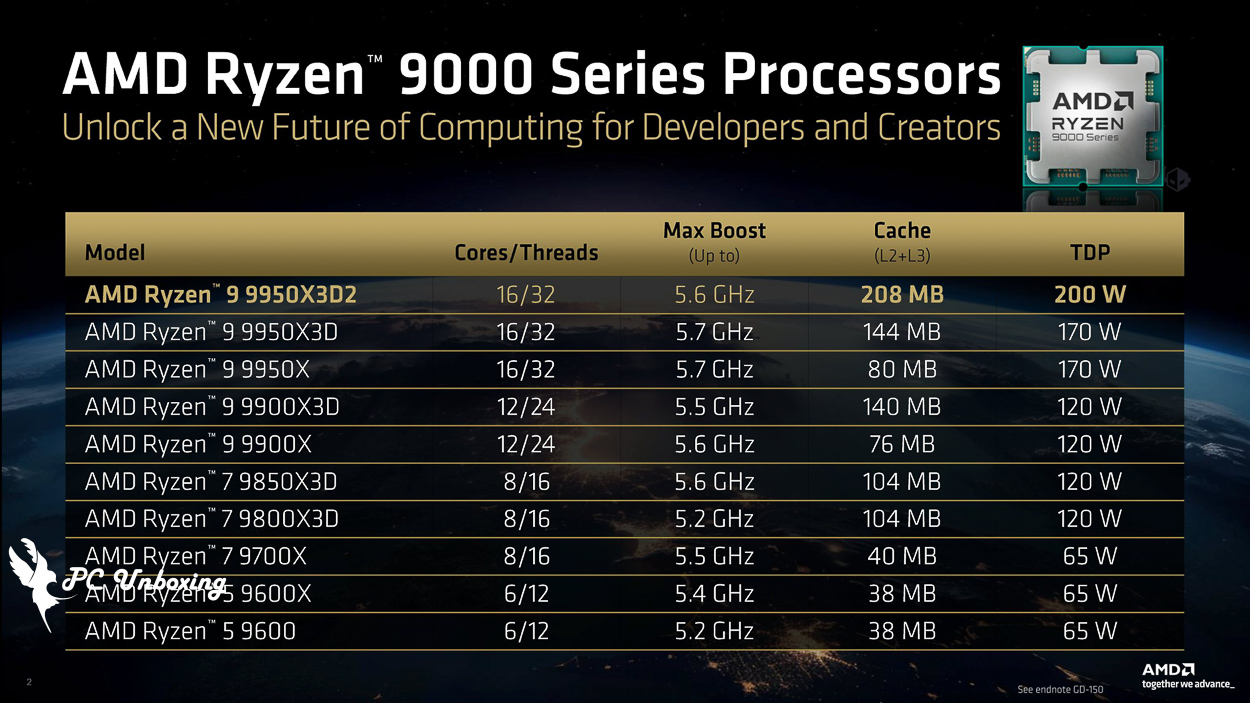
△ AMD Ryzen 9000 series specification comparison.
The AMD Ryzen 9 9950X3D2 Dual Edition's proposed price is $899, while last year's Ryzen 9 9950X3D's proposed price was $699, and Taiwan's sales channel is NT$25,250, which translates to 1:36.1 exchange rate, the Ryzen 9 9950X3D2 Dual Edition might be NT$32,474, I guess NT$32,990 or 33,490 or something like that. If the exchange rate is 1:36.1, then the Ryzen 9 9950X3D2 Dual Edition would be $32,474, and the author guesses that it would be $32,990 or $33,490 or something like that. Honestly speaking, the price of 9950X3D2, which is $200 more expensive than that of the 9950X3D, is really going to scare a lot of people away from purchasing the product.
Proposed Price.
AMD Ryzen 9 9950X3D2 Testbed Configuration with BIOS and Memory Setup Details

In addition to testing the performance of the AMD Ryzen 9 9950X3D2 Dual Edition, we have also added the AMD Ryzen 9 9950X3D2 Dual Edition to the test. AMD Ryzen 9 9950X3D 和 Intel Core Ultra 9 285K Two consumer flagship processors were compared for gaming performance, and the motherboards were ASRock X870E Taichi OCF The BIOS has been updated to version 4.10, and the memory has been updated using the Origin code vortex DDR5 48 GB (24 GBx2) And open EXPO Profile 2:8000 MT/s CL36-47-47-108 1.45V, the graphics card is with NVIDIA RTX 4080, I would like to test with 5090 / 5080.
AMD Testing Platform
Processor: AMD Ryzen 9 9950X3D2 Dual Edition / AMD Ryzen 9 9950X3D
Motherboard:ASRock X870E Taichi OCF (BIOS version: 4.10)
Memory:Origin code vortex DDR5 48 GB (24 GBx2) 8000 MT/s CL36-47-47-108 1.45V
Cooler: LIAN LI GA II Trinity SL-INF 360 (full speed)
Water-cooled fan: LIAN LI P28 (full speed)
Thermal paste: Cooler Master MASTERGEL MAKER 40g (thermal conductivity 11W/mK)
Graphics: NVIDIA GeForce RTX 4080 Founders Edition
Power supply:LIAN LI RS1000G
Case: STREACOM BC1 Benchtable V2
Graphics driver: GeForce Game Ready 595.97
Intel Test Platform
Processor:Intel Core Ultra 9 285K QS
Motherboard:GIGABYTE Z890 AORUS TACHYON ICE(BIOS version: F6)
Memory:Origin code vortex DDR5 48 GB (24 GBx2) 8000 MT/s CL36-47-47-108 1.45V
Cooler: Valkyrie E360 (full speed)
Thermal paste: Cooler Master MASTERGEL MAKER 40g (thermal conductivity 11W/mK)
Water cooling fan: 3X XPG VENTO PRO 120 PWM (full speed)
Graphics: NVIDIA GeForce RTX 4080 Founders Edition
Power supply:MONTECH TITAN PLA 1000W
Case: STREACOM BC1 Benchtable V2
Graphics driver: GeForce Game Ready 595.97
For the platform BIOS setting, only the memory Profile 2 is manually turned on, the other settings are kept as default Auto, and the cooler is manually set to run at full speed with the PUMP and fan. In order to avoid any problems, you must update to the latest version of the motherboard BIOS, download the latest version of the AMD chipset driver from the official website of the motherboard, and extract the AMD chipset driver to install the relevant drivers. chipset driver and extract the AMD chipset driver to install the related driver.
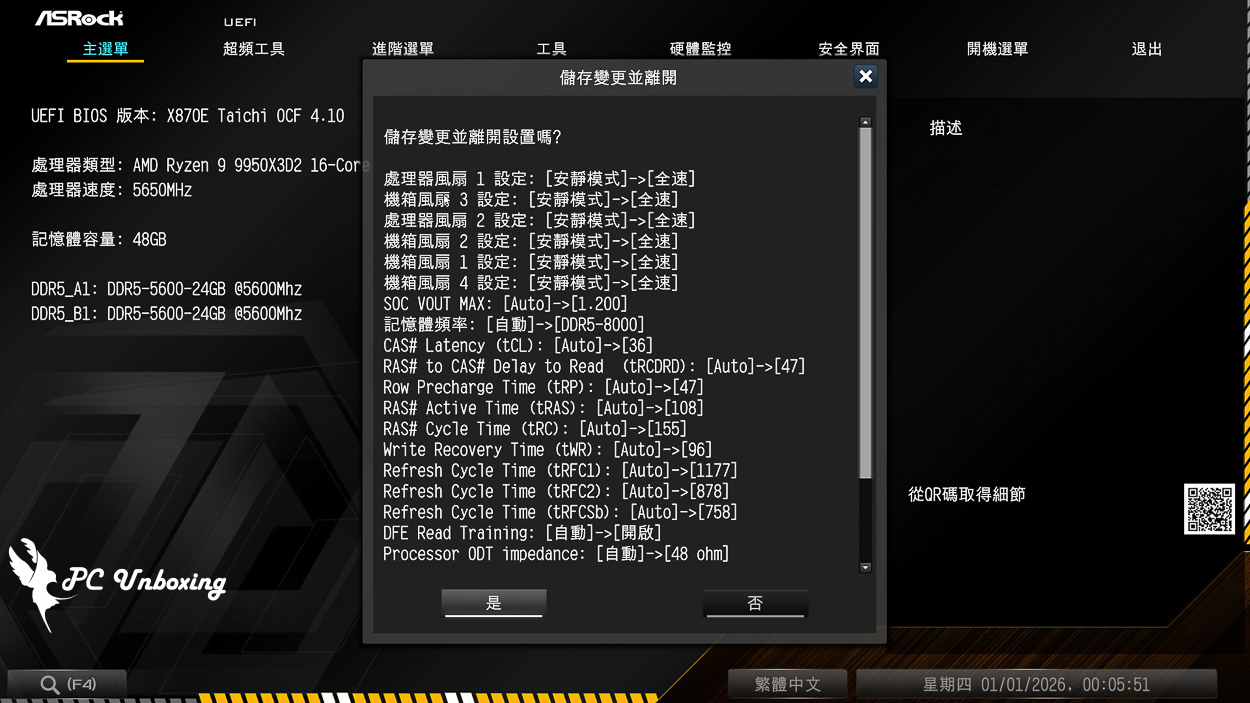
△ The BIOS overclocking related settings only enable Profile.
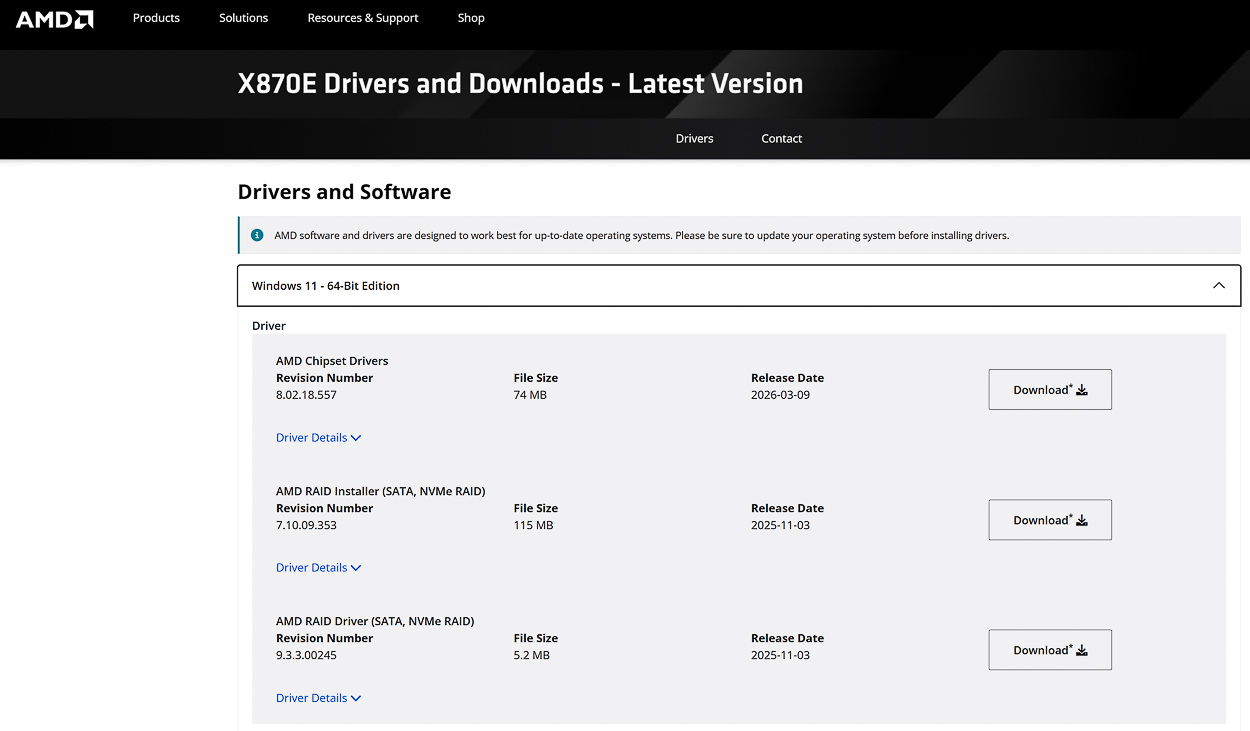
Download the latest version of AMD chipset driver from the official website.
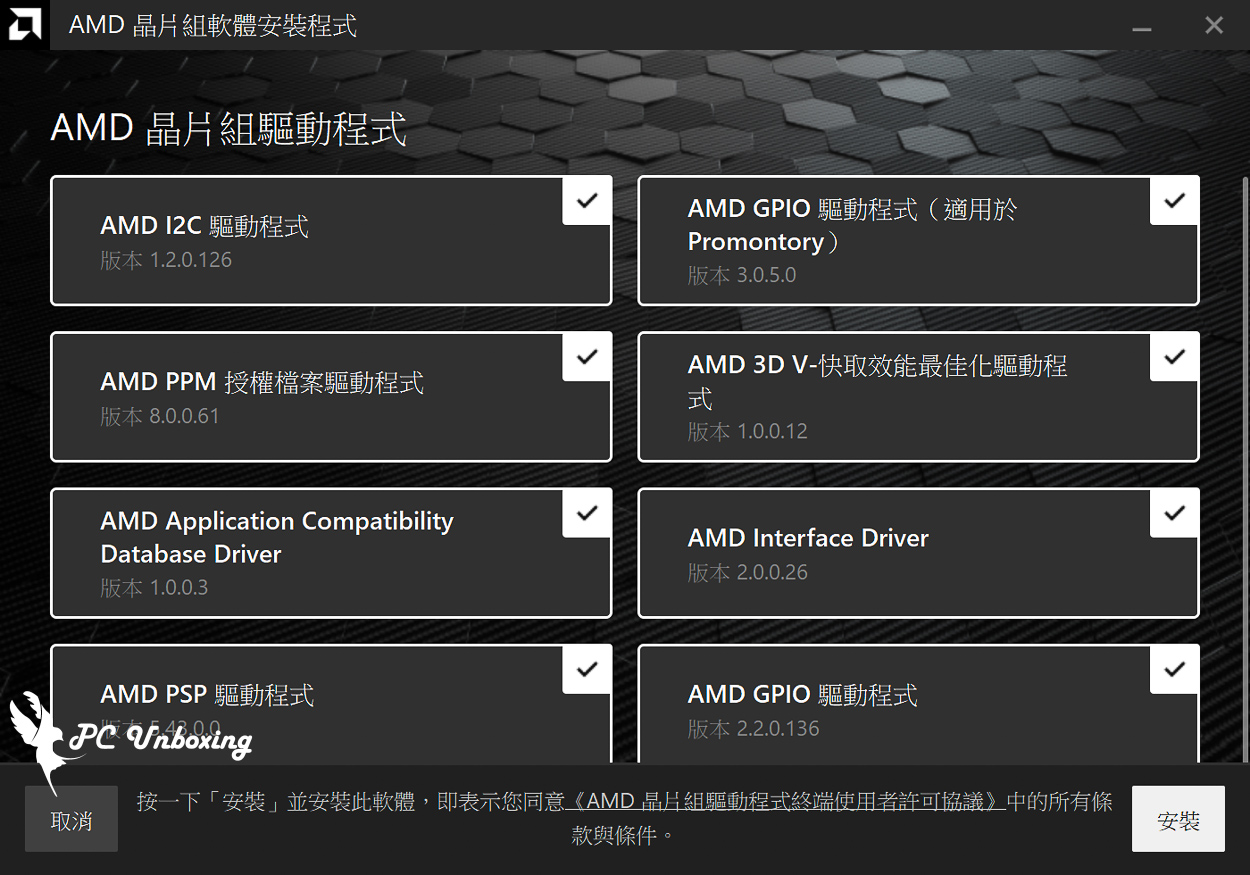
△ Unzip the AMD chipset driver and download the related driver.
AMD Ryzen 9 9950X3D2 CPU Score Test: Computing and Rendering Performance Measurements (Cinebench/AIDA64)
firstly CPU-Z Viewing the hardware information of the test platform, AMD Ryzen 9 9950X3D2 Dual Edition processor has 16 cores and 32 threads, the series code name is Granite Ridge using TSMC 4nm FinFET process, the motherboard is using ASRock X870E Taichi OCF supporting PCI-E 5.0 lanes and the BIOS is 4.10 version. The motherboard uses ASRock X870E Taichi OCF to support PCI-E 5.0 lanes and BIOS version 4.10.
We also ran the CPU-Z internal tests for your reference.
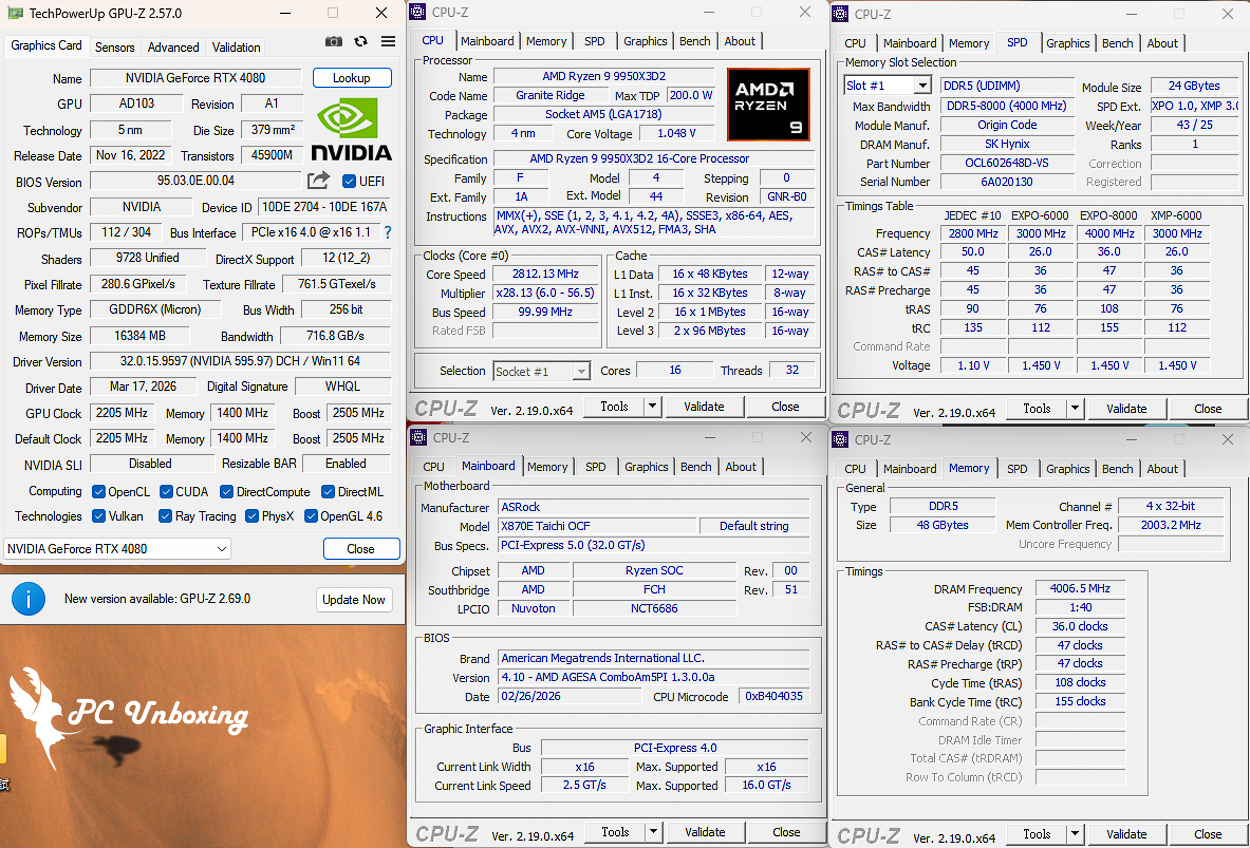
CPU-Z platform information at a glance.
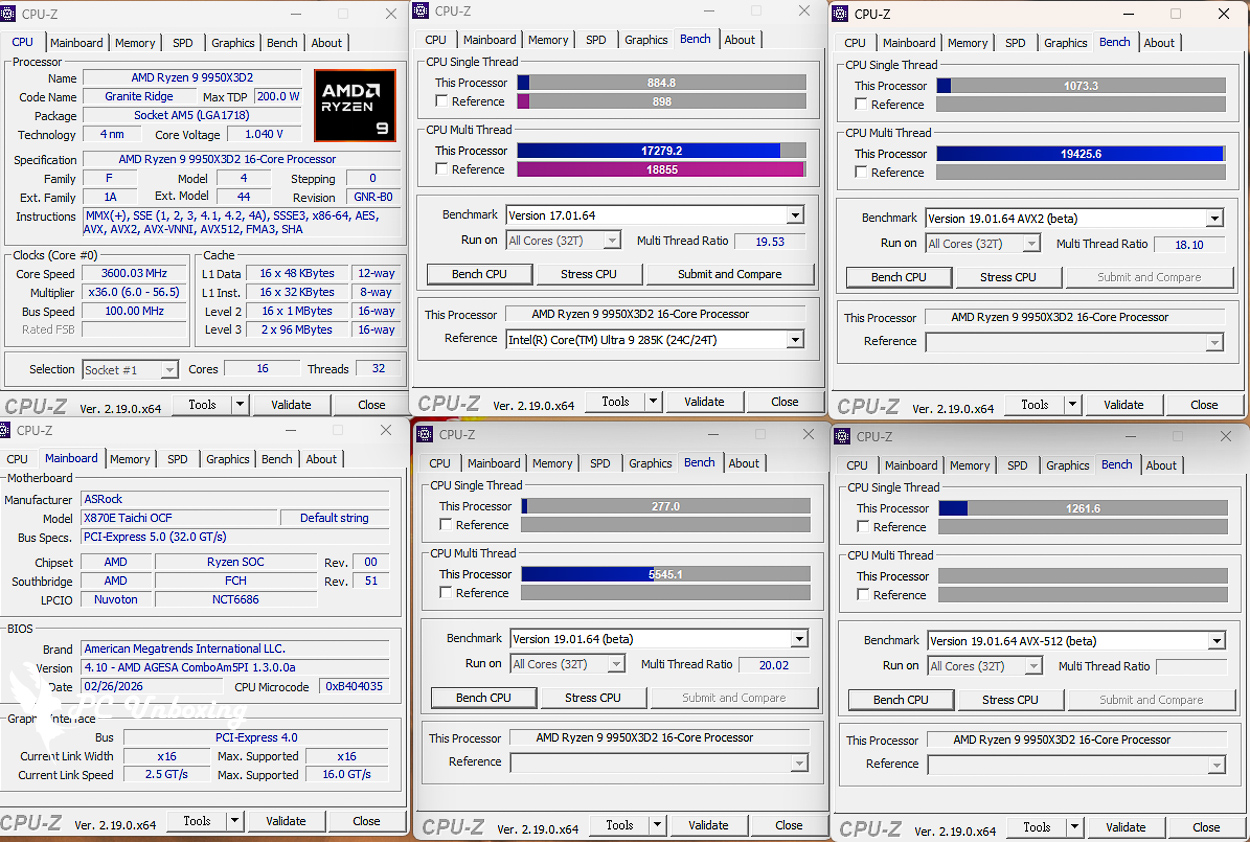
△ AMD Ryzen 9 9950X3D2_CPU-Z internal test score results.
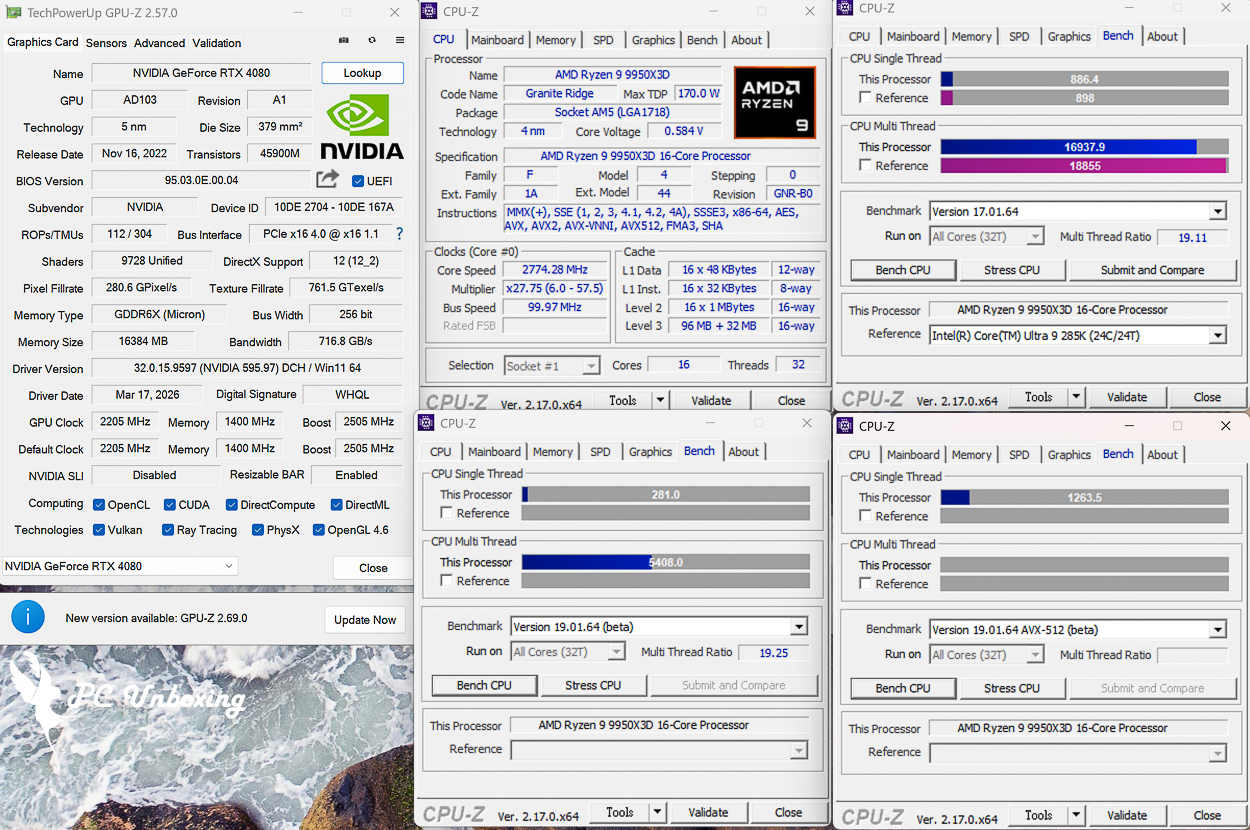
△ AMD Ryzen 9 9950X3D_CPU-Z internal test score results.
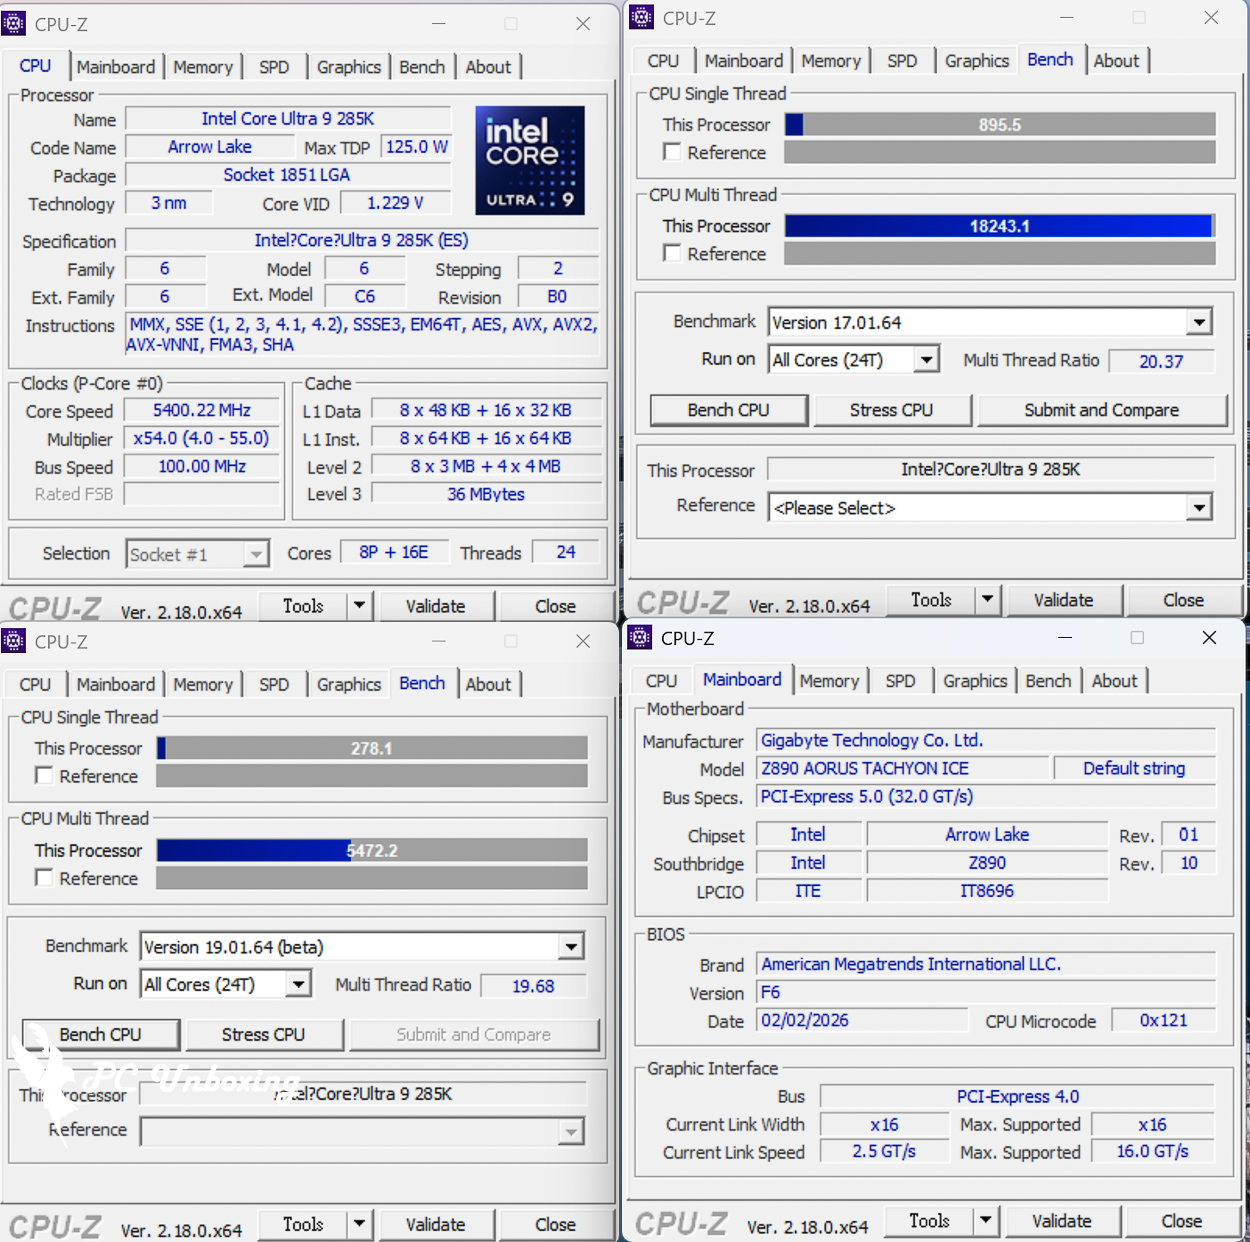
△ Intel Core Ultra 9 285K_CPU-Z built-in test score results.
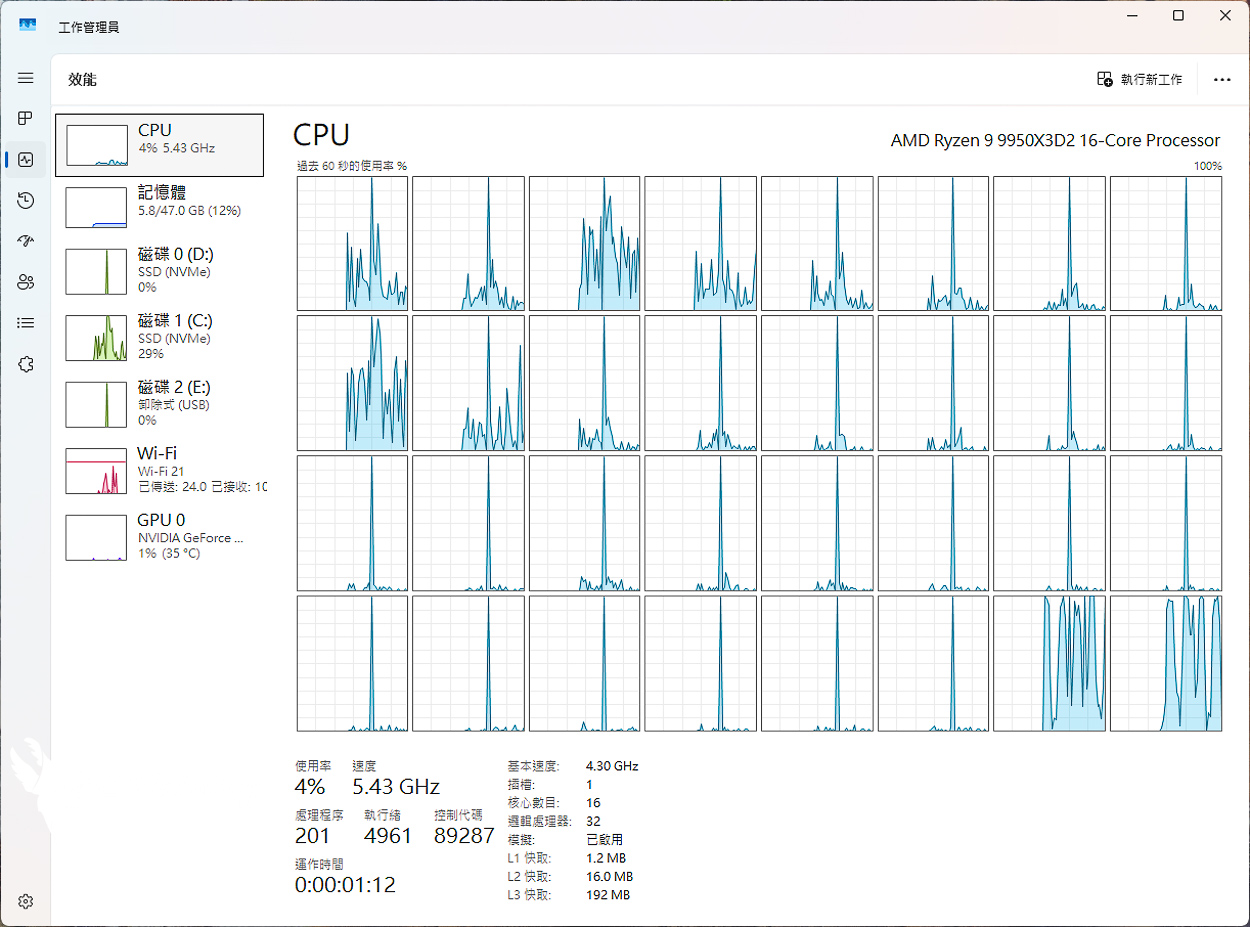
△ Work manager.
AIDA64 Cache & Memory Benchmark It is mainly used to test the performance of processor caches and RAM. The read/write/copy bandwidth performance score represents the rate of transfer between CPU and memory, which means the efficiency of data throughput (the higher the score, the better), and the time delay score of accessing data indicates the responsiveness of the memory system.
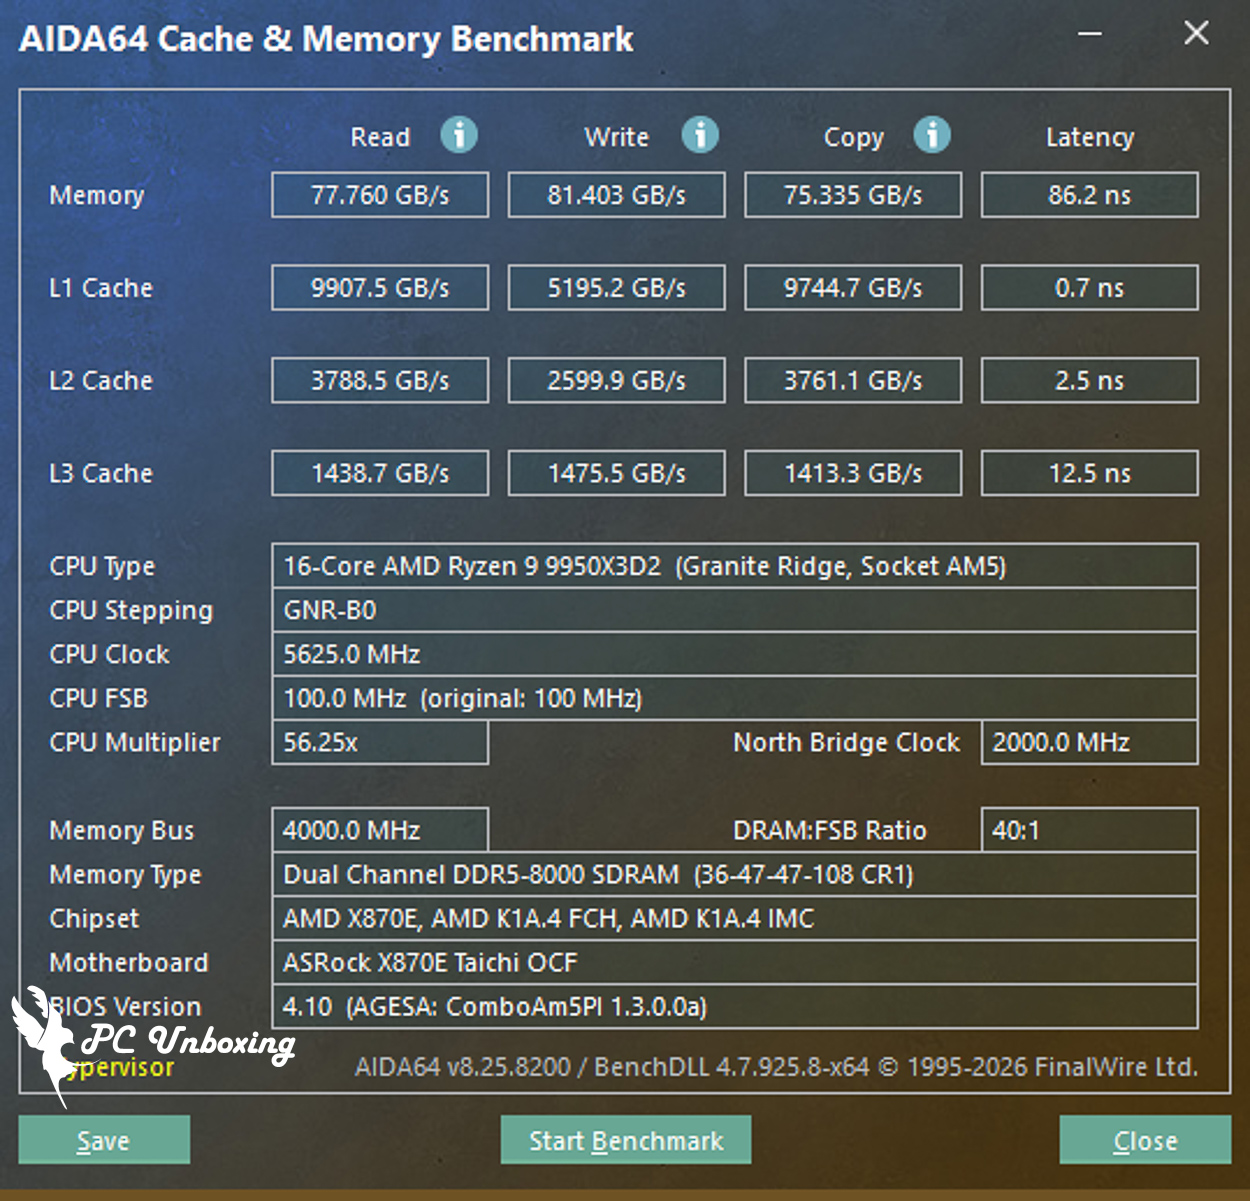
△ AMD Ryzen 9 9950X3D2_AIDA64 Cache and Memory Test.
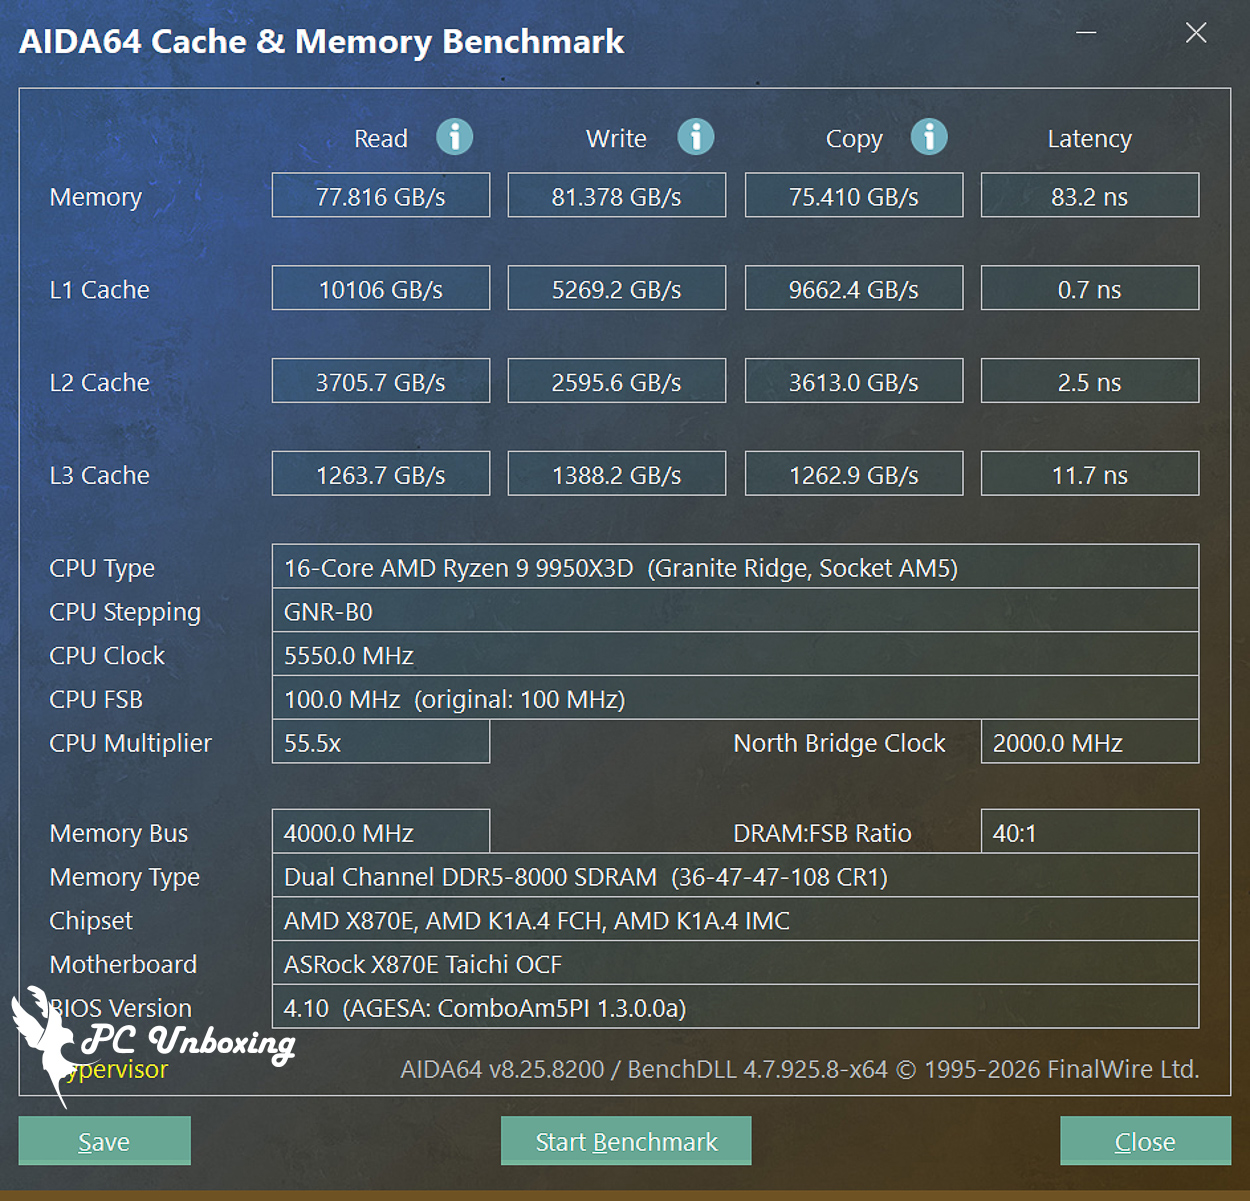
△ AMD Ryzen 9 9950X3D_AIDA64 Cache and Memory Test.
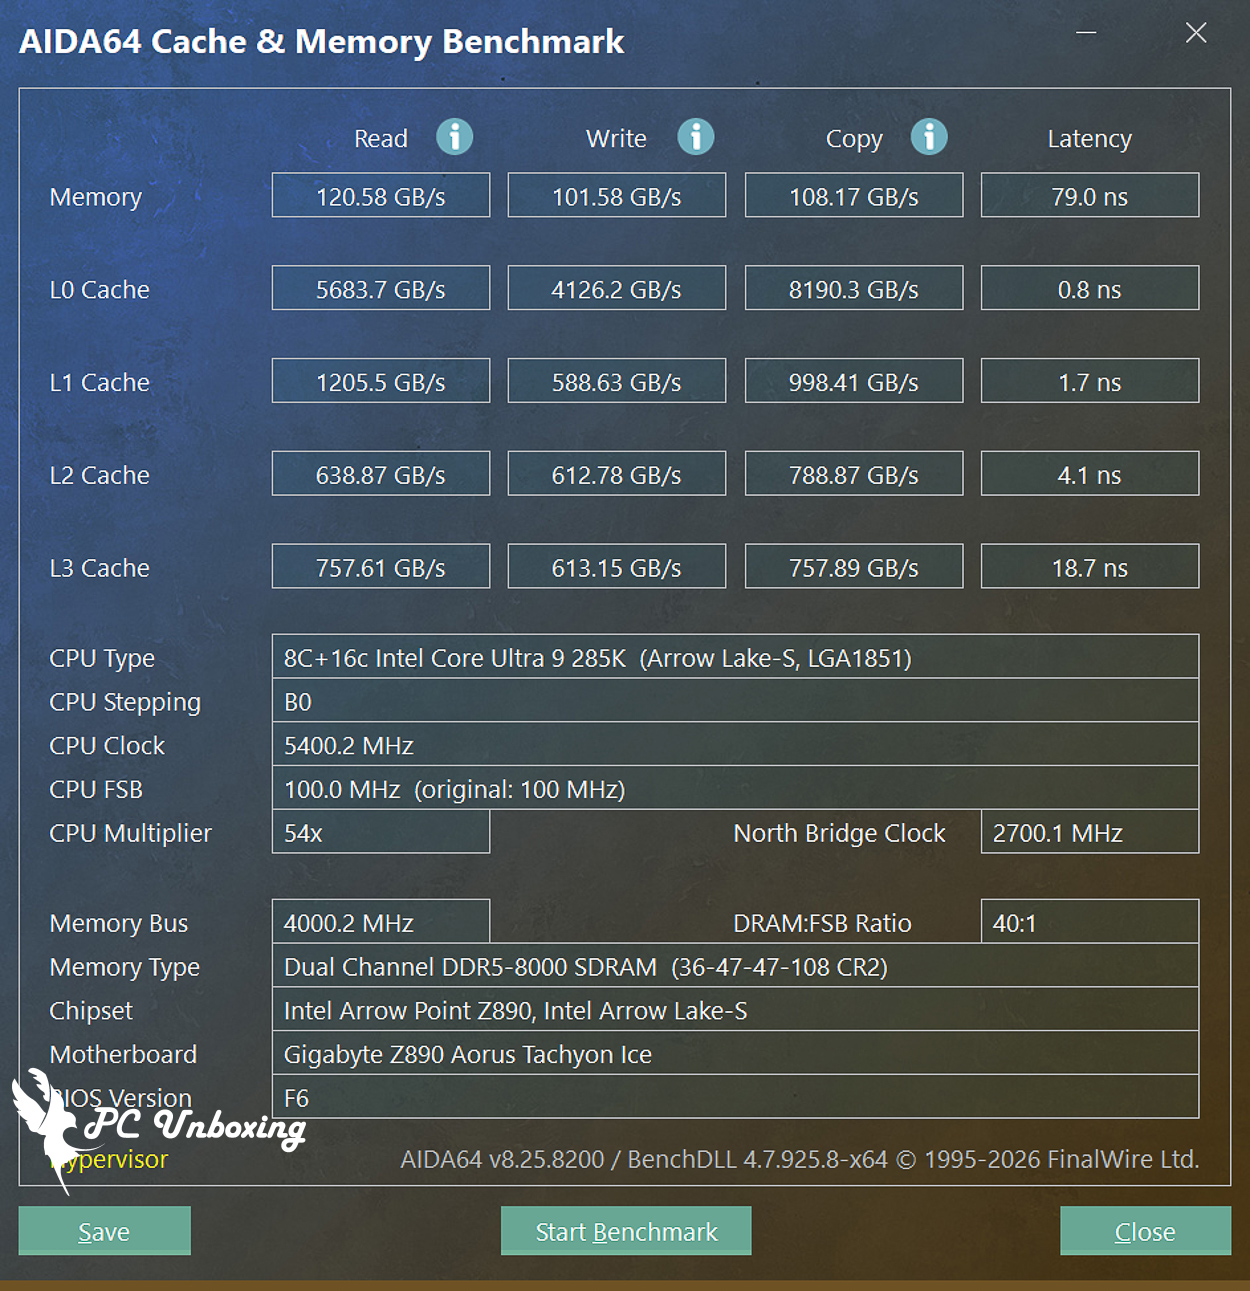
△ Intel Core Ultra 9 285K_AIDA64 cache and memory test.
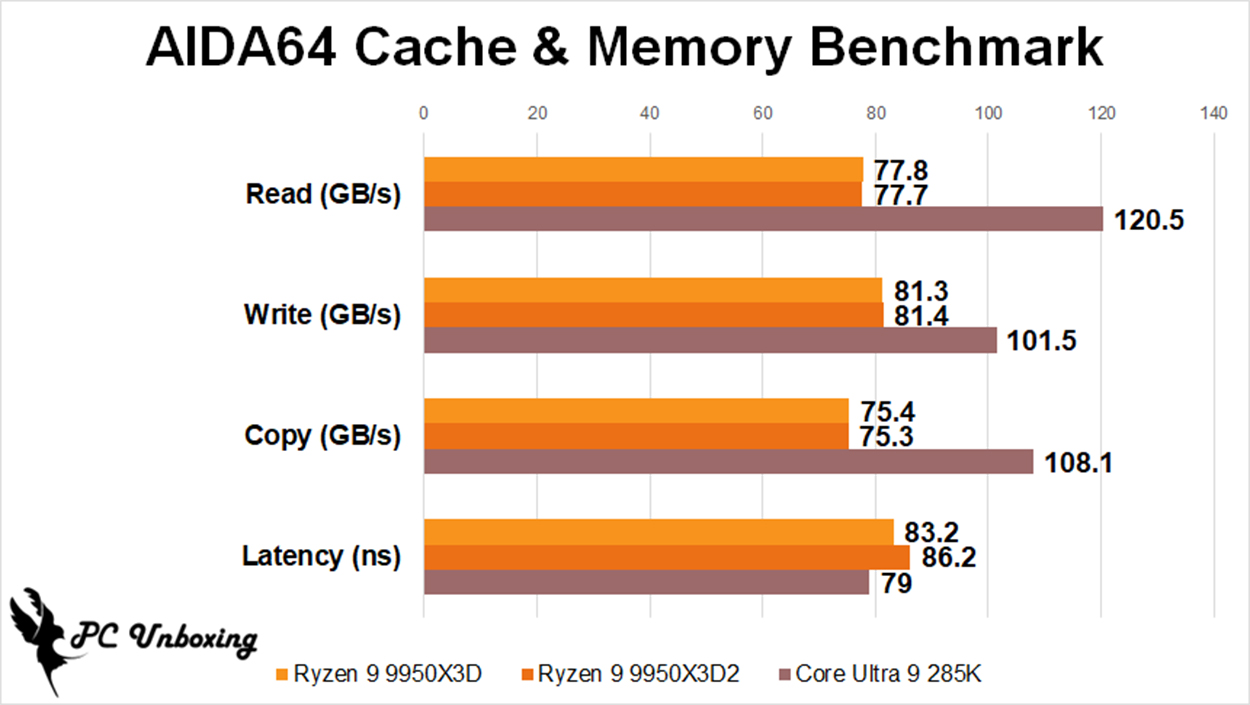
AIDA64 comparison chart.
I ran away at the same time. AIDA64 GPGPU Benchmark For your reference.
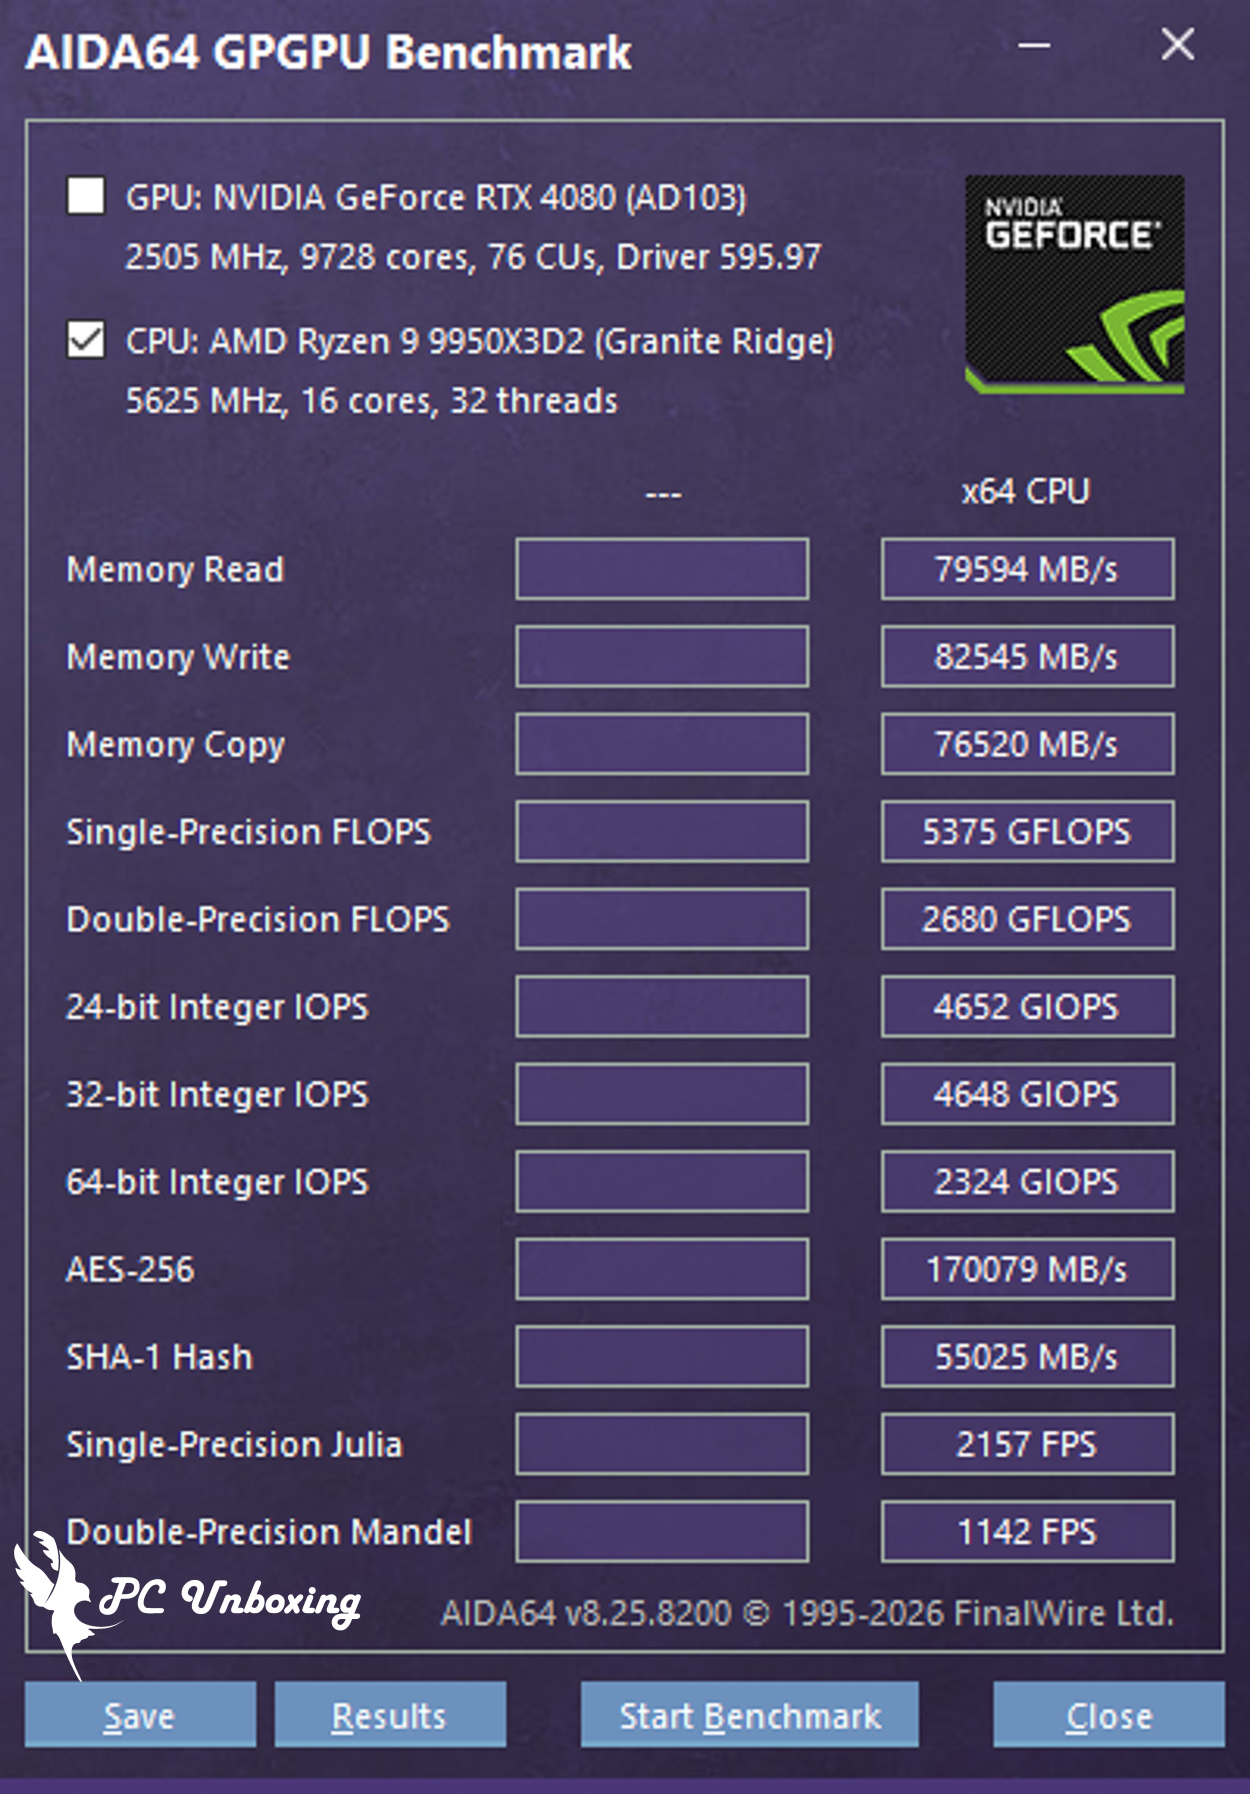
△ AMD Ryzen 9 9950X3D2_AIDA64 GPGPU Benchmark.
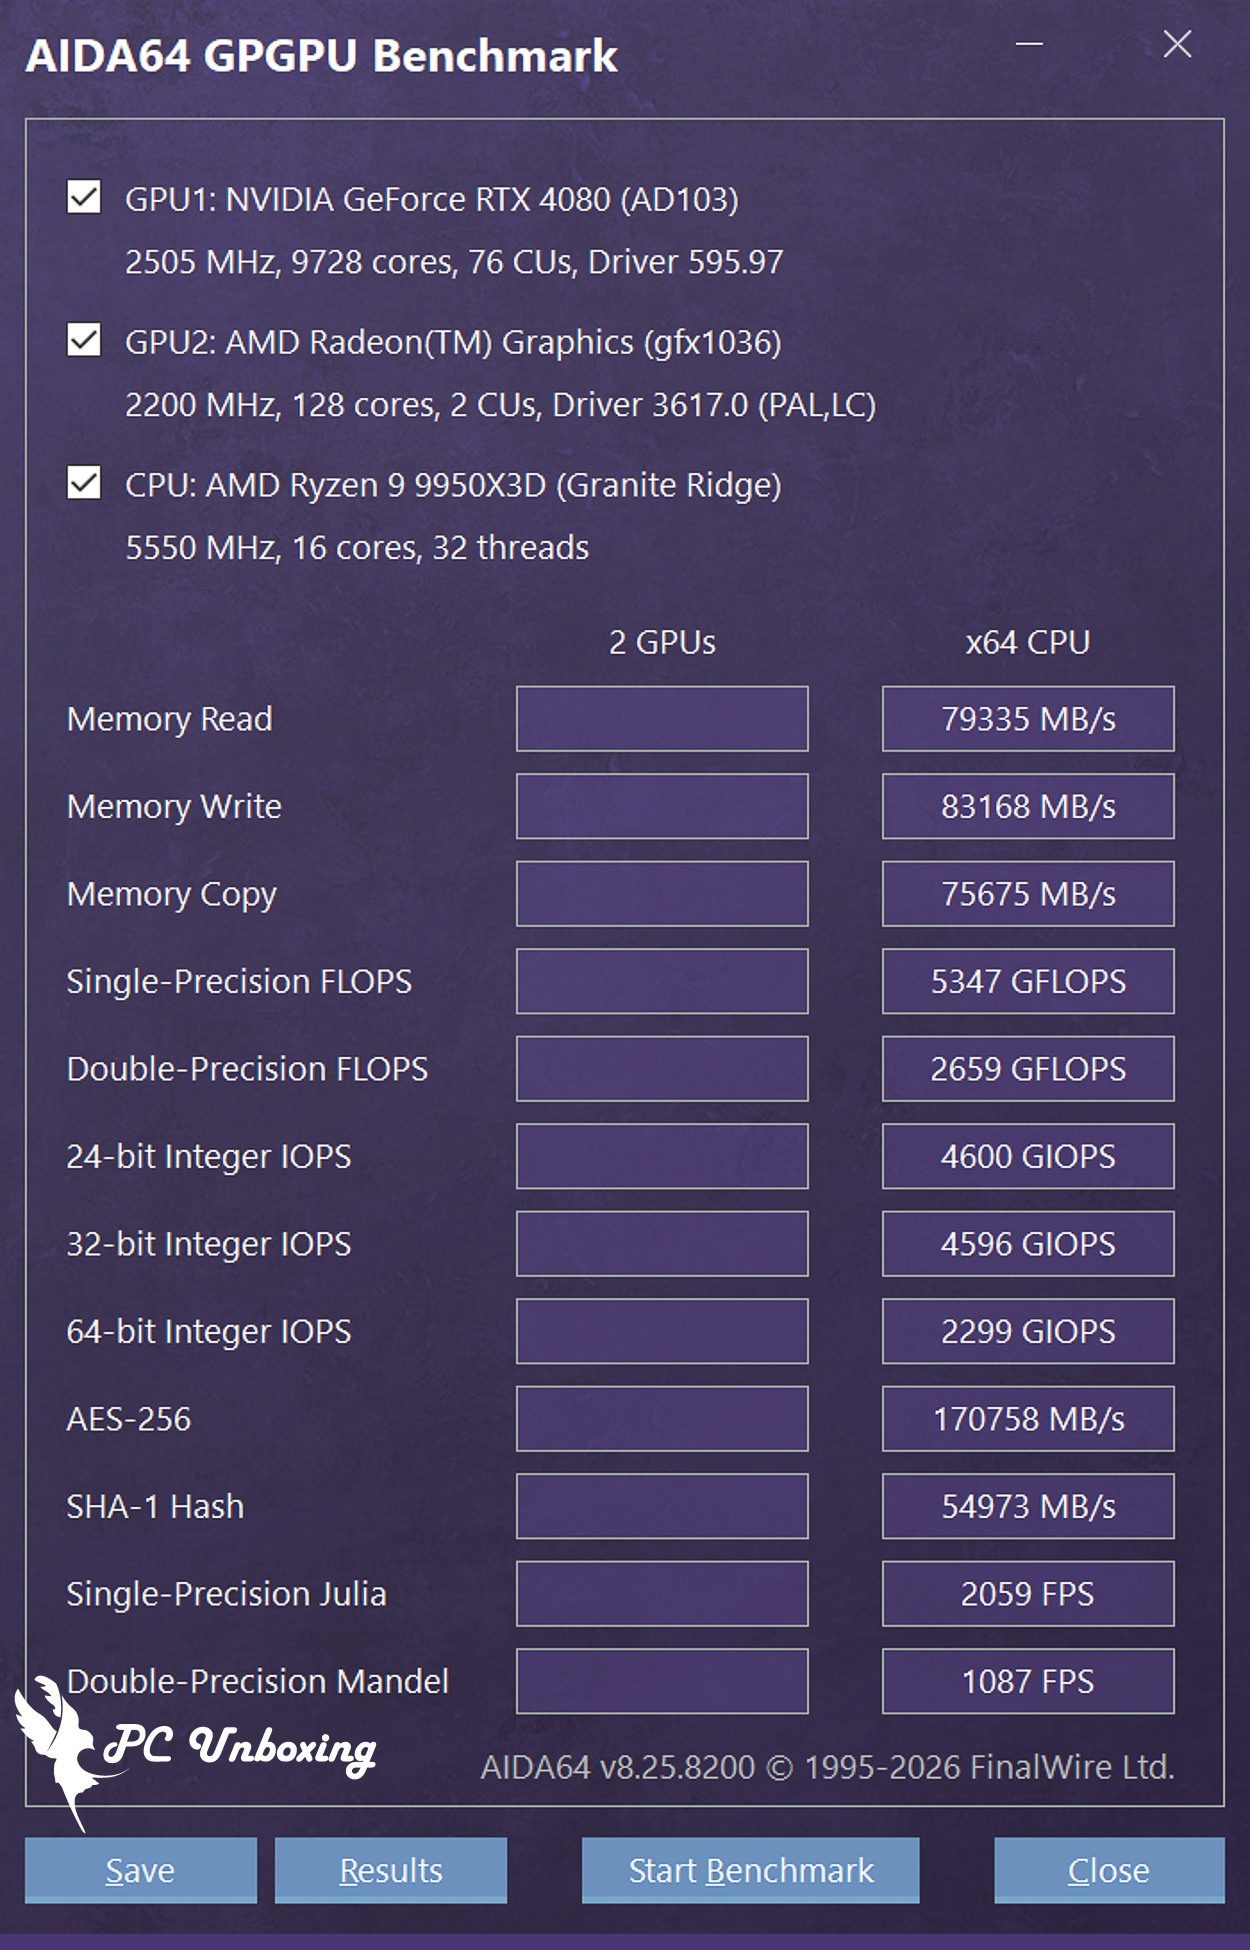
△ AMD Ryzen 9 9950X3D_AIDA64 GPGPU Benchmark.
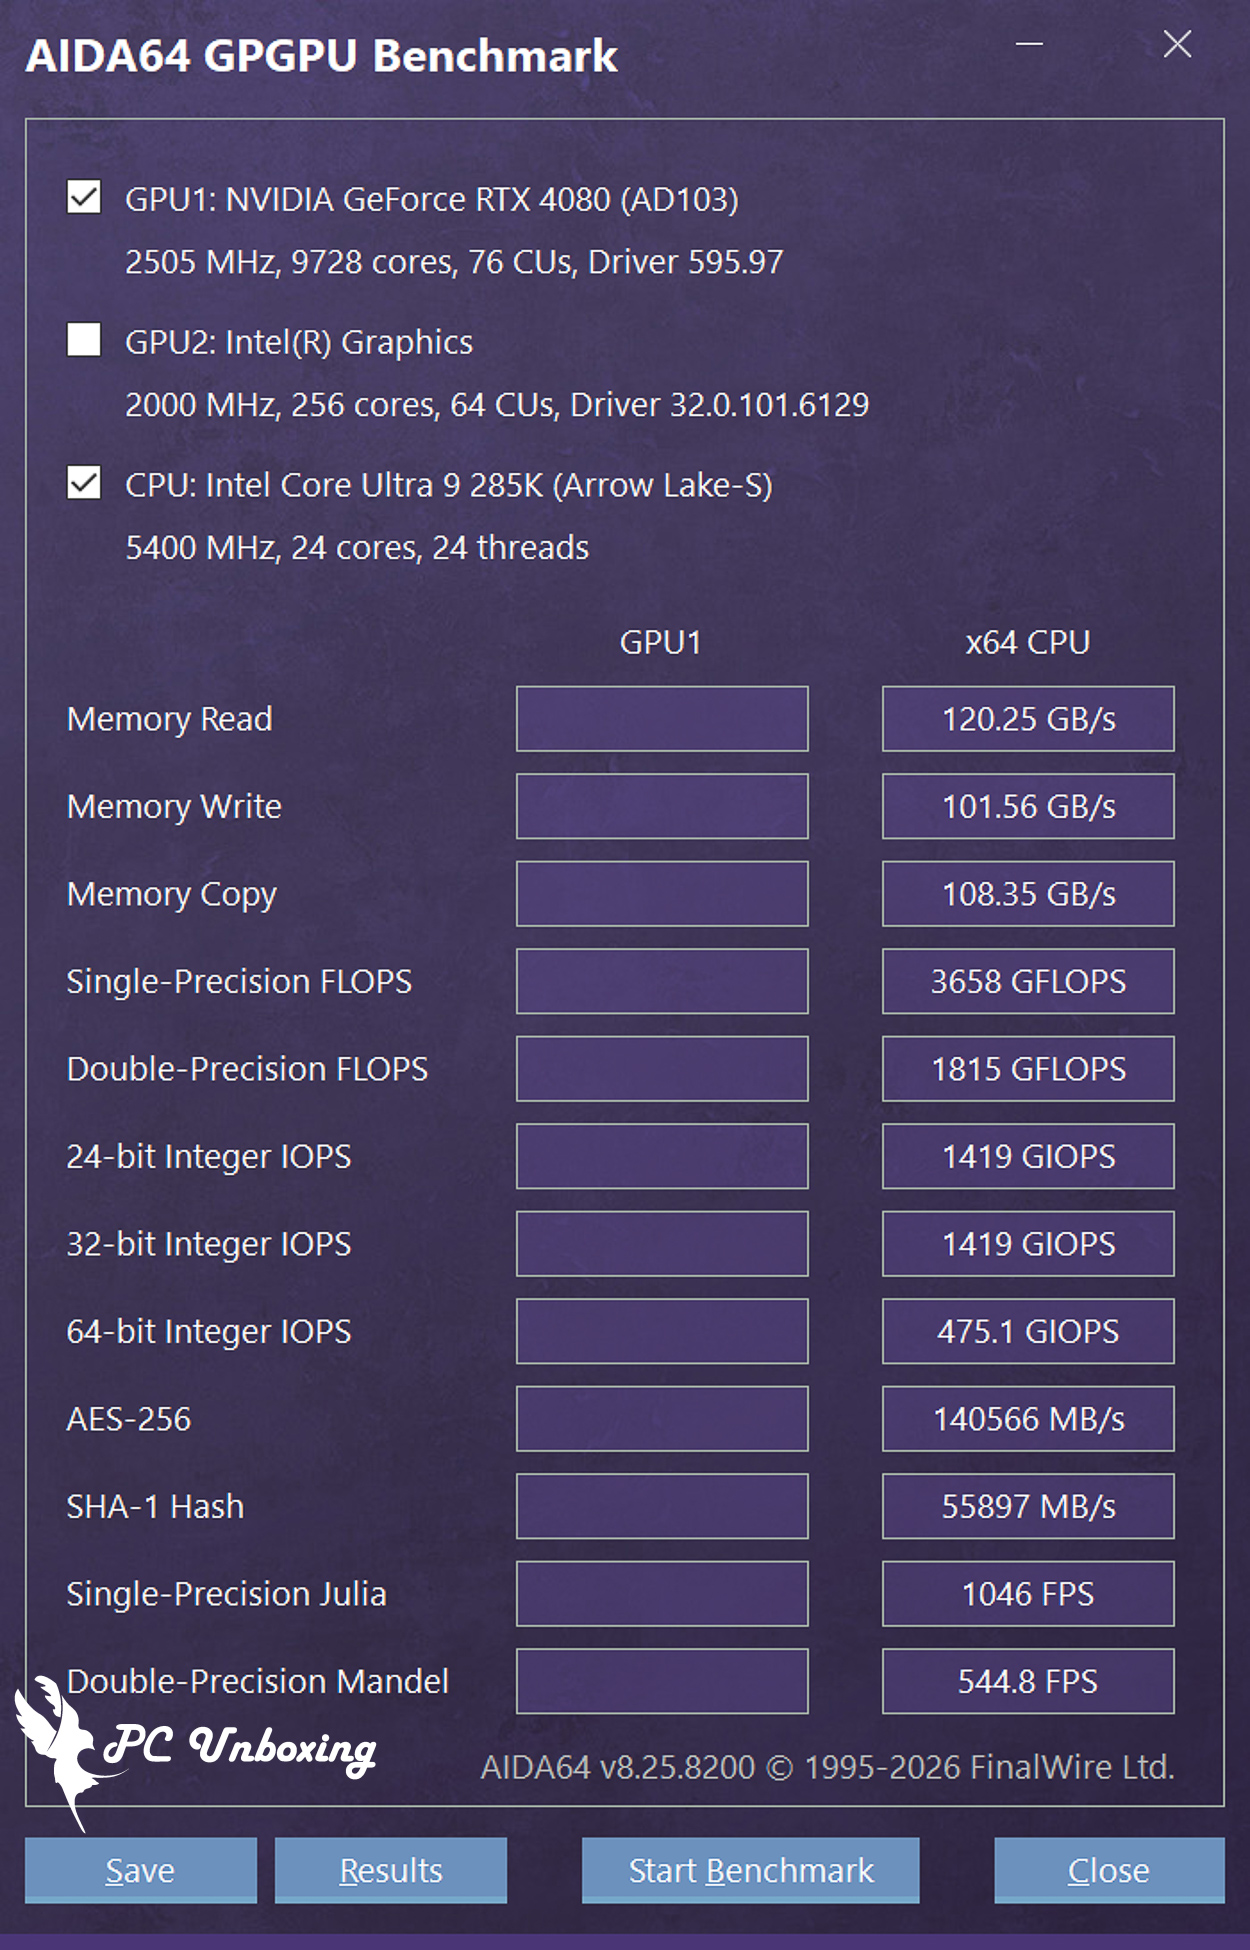
△ Intel Core Ultra 9 285K_AIDA64 GPGPU Benchmark.
by Maxon Cinebench An industry-standard benchmarking software, Cinebench 2026 tests GPU and CPU performance using Maxon's powerful Redshift rendering engine.
The new version of Cinebench 2026 adds a test for evaluating the performance of SMT-enabled CPU cores, which means that it is now possible to test: GPU, processor full-core, processor single-core, and processor single-thread performance.
Based on the latest Cinema 4D 2026 and Redshift code, and using the updated Clang V19 compiler, the benchmarking accuracy of contemporary and next-generation processors has been improved to test whether the equipment is stable under high loads, whether the thermal solutions of the desktop or laptop are sufficient to cope with the demands of long-term operation in order to maximize the potential of the CPU, and whether the machine is capable of handling demanding 3D tasks. and whether the machine is capable of handling demanding 3D tasks.
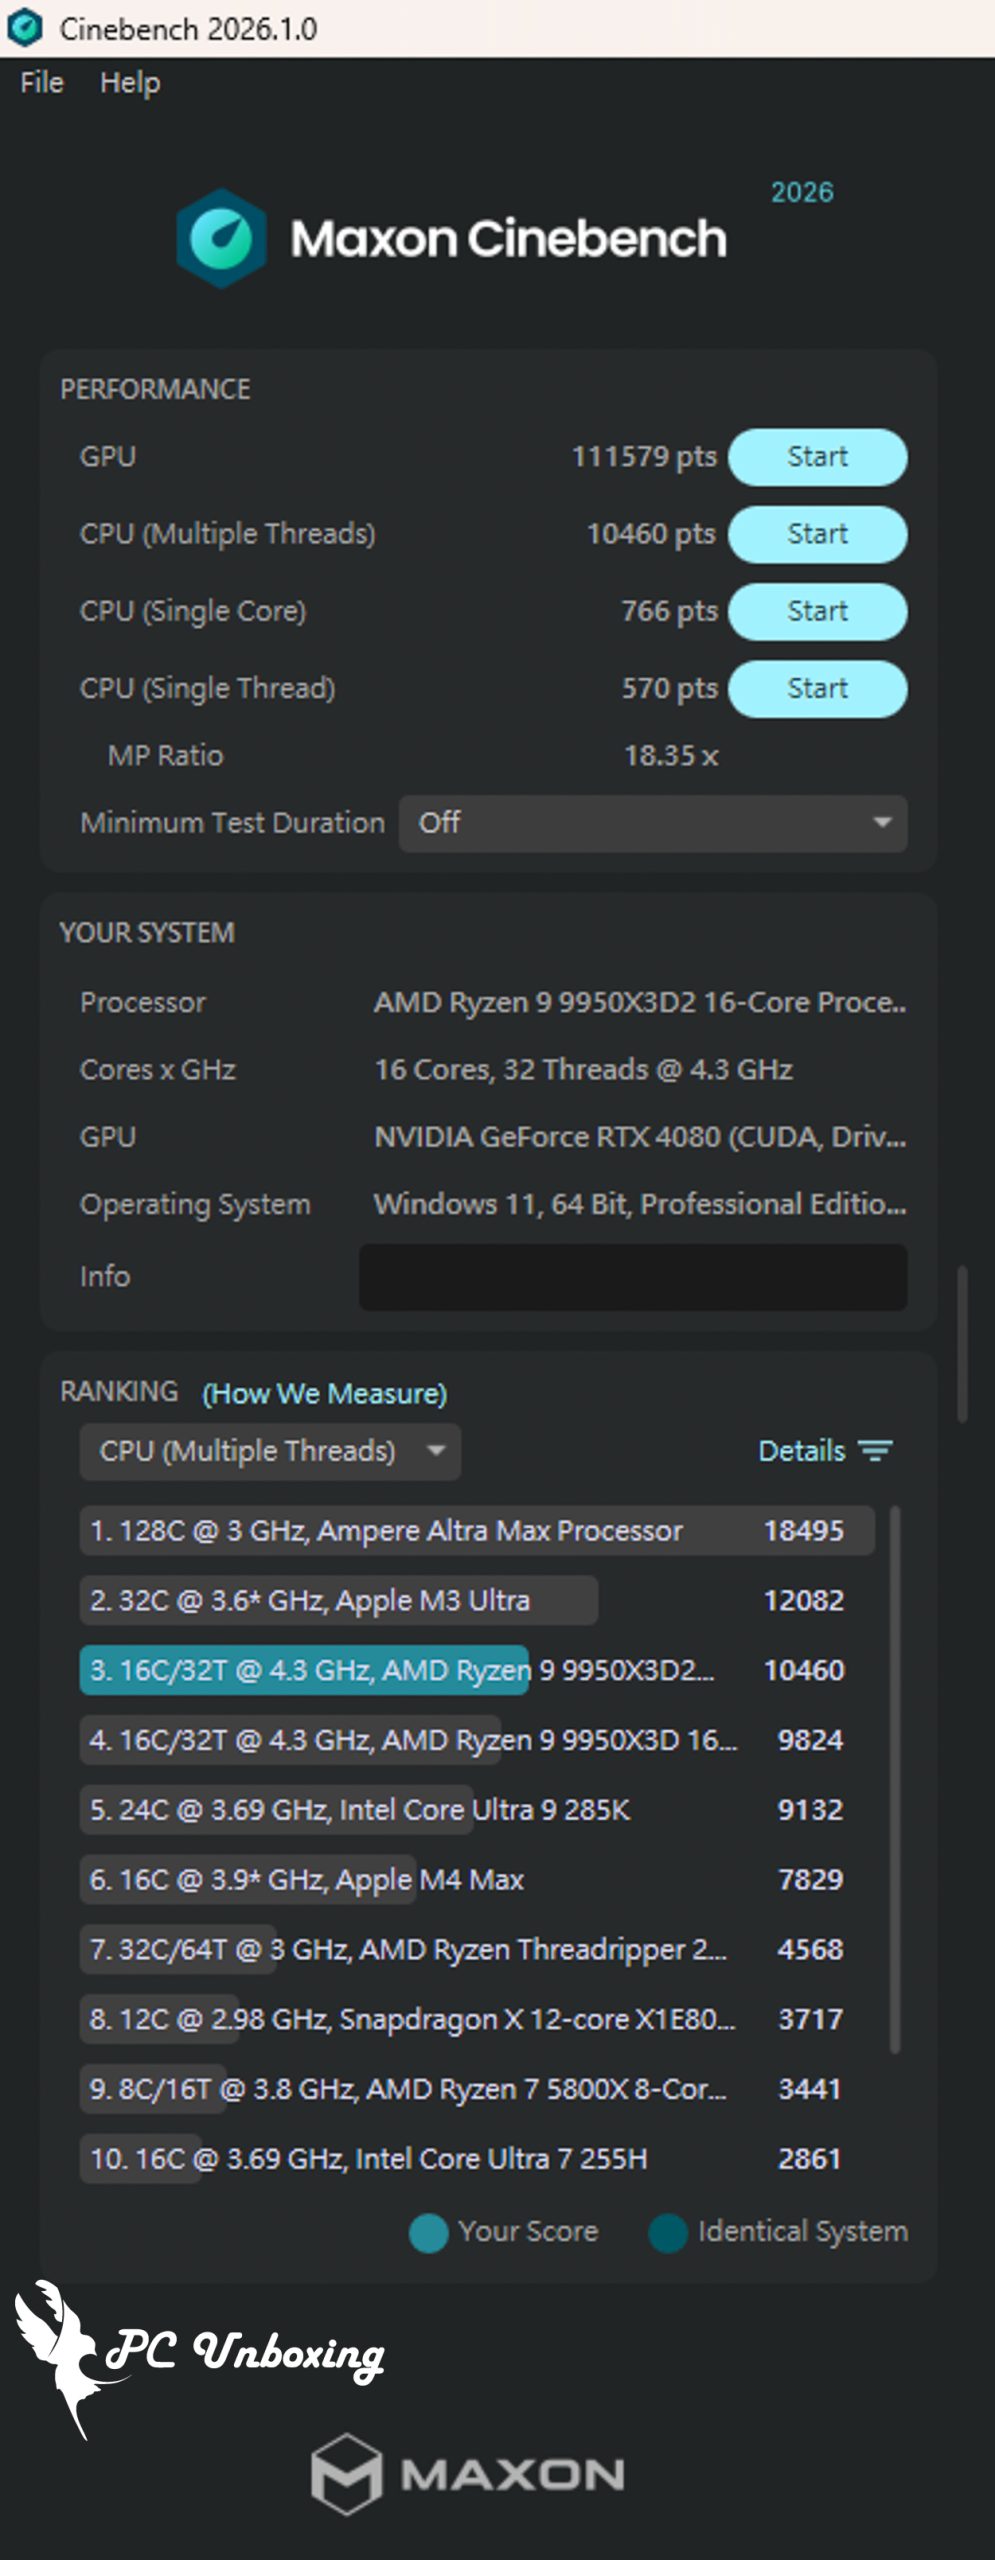
△ Cinebench 2026.
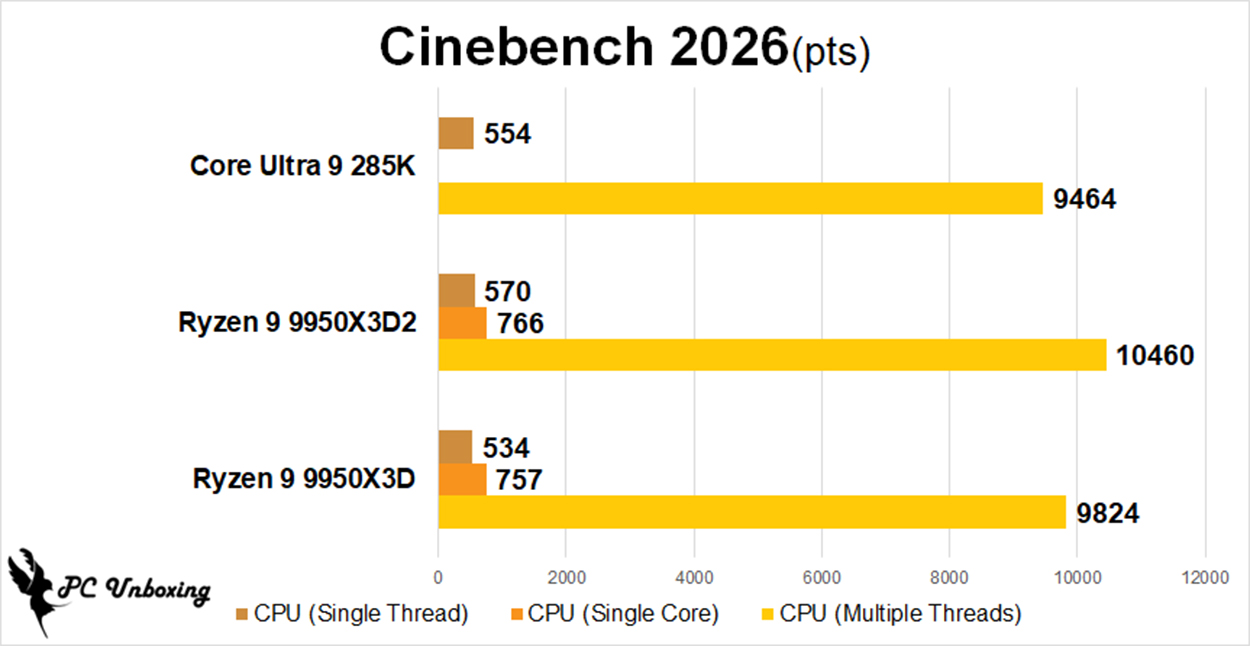
△ Cinebench 2026 comparison chart.
V-Ray 6 Benchmark V-Ray Engine Test Software is an image rendering program developed by Chaos Group. The free Benchmark examines the rendering speeds of the CPU and GPU on the V-Ray Engine, which tests the rendering performance of the processor.
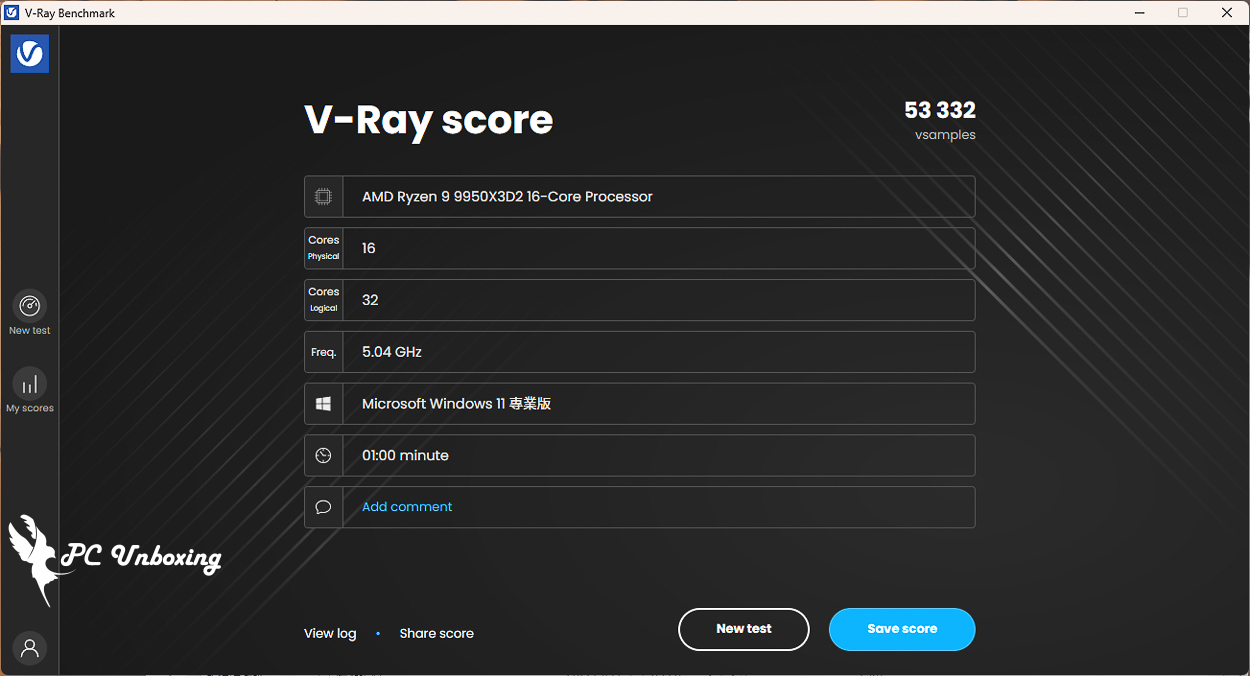
△ V-Ray 6 Benchmark.
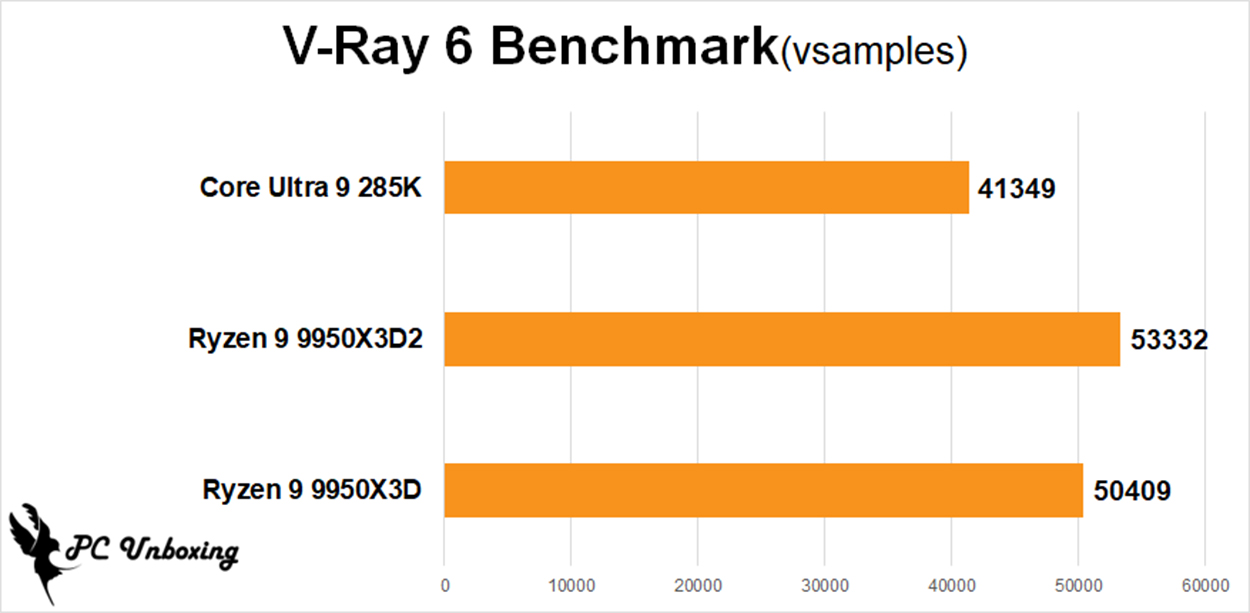
△ V-Ray 6 Benchmark comparison chart.
Corona Benchmark is a free test software based on the Corona 10 rendering core that evaluates the performance of a system by using Corona 10 rendered scenes to measure the rendering speed of the system in terms of rays per second (rays/s). More rays per second means faster rendering, and the scores are linearly scaled. For example, a system with 6 million rays per second will have twice the rendering speed and performance of a system with 3 million rays per second.
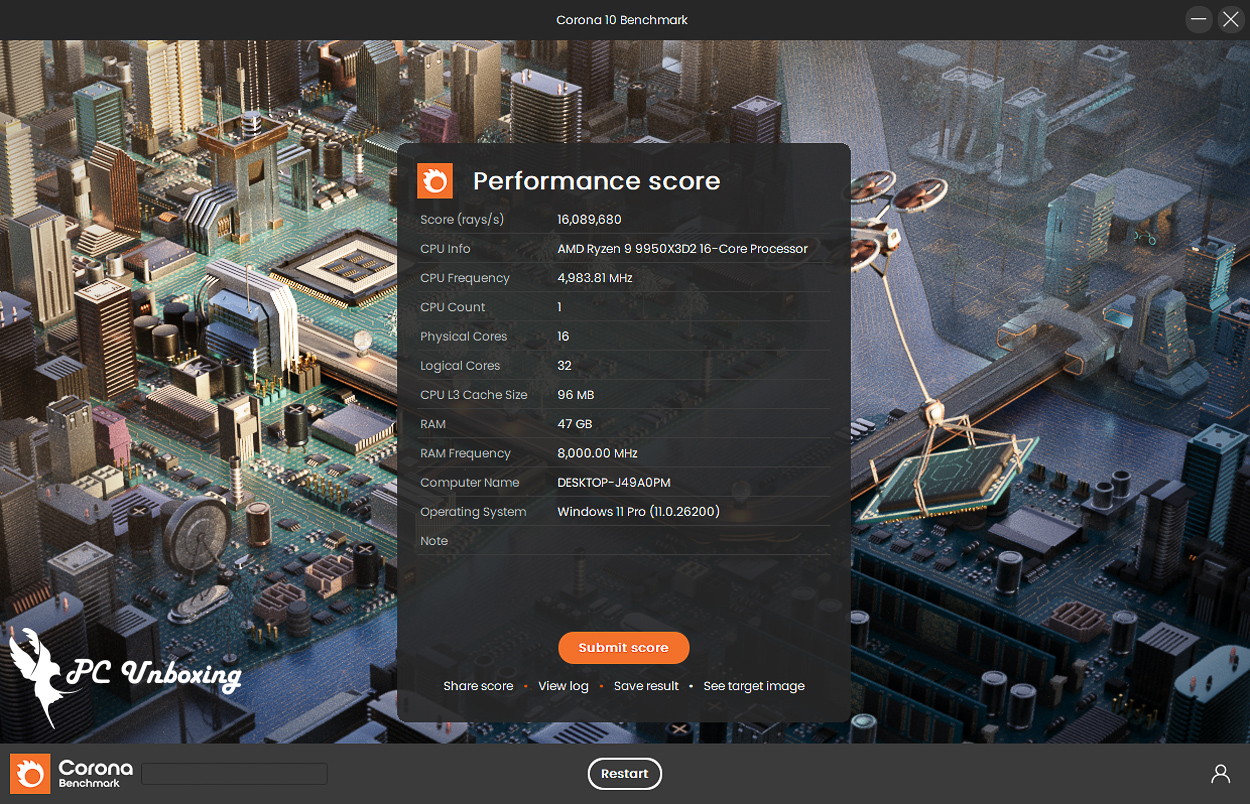
△ Corona Benchmark.
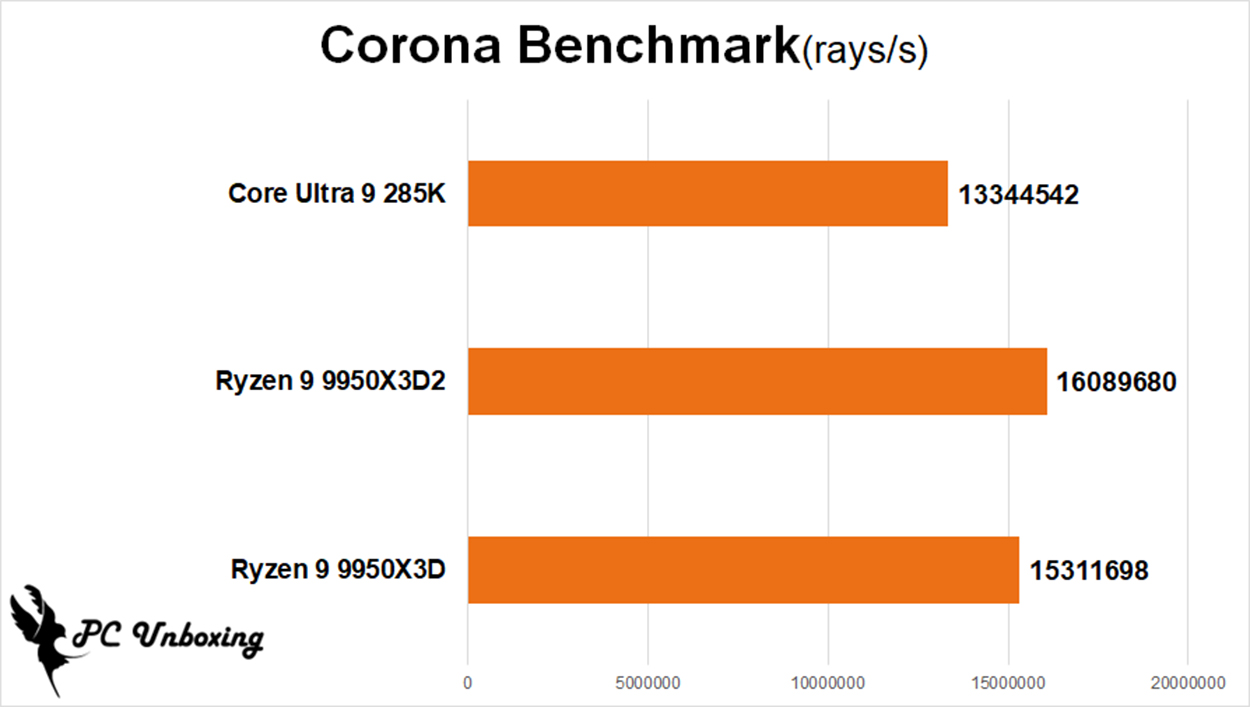
Corona Benchmark comparison chart.
PCMark 10 It also simulates test scenarios to determine the overall performance of the computer. The common basic functions include application launching, web browsing, and video conferencing tests, while productivity simulates document and spreadsheet writing, and the last item, video content creation, includes professional tests such as photo editing, video editing, and rendering.
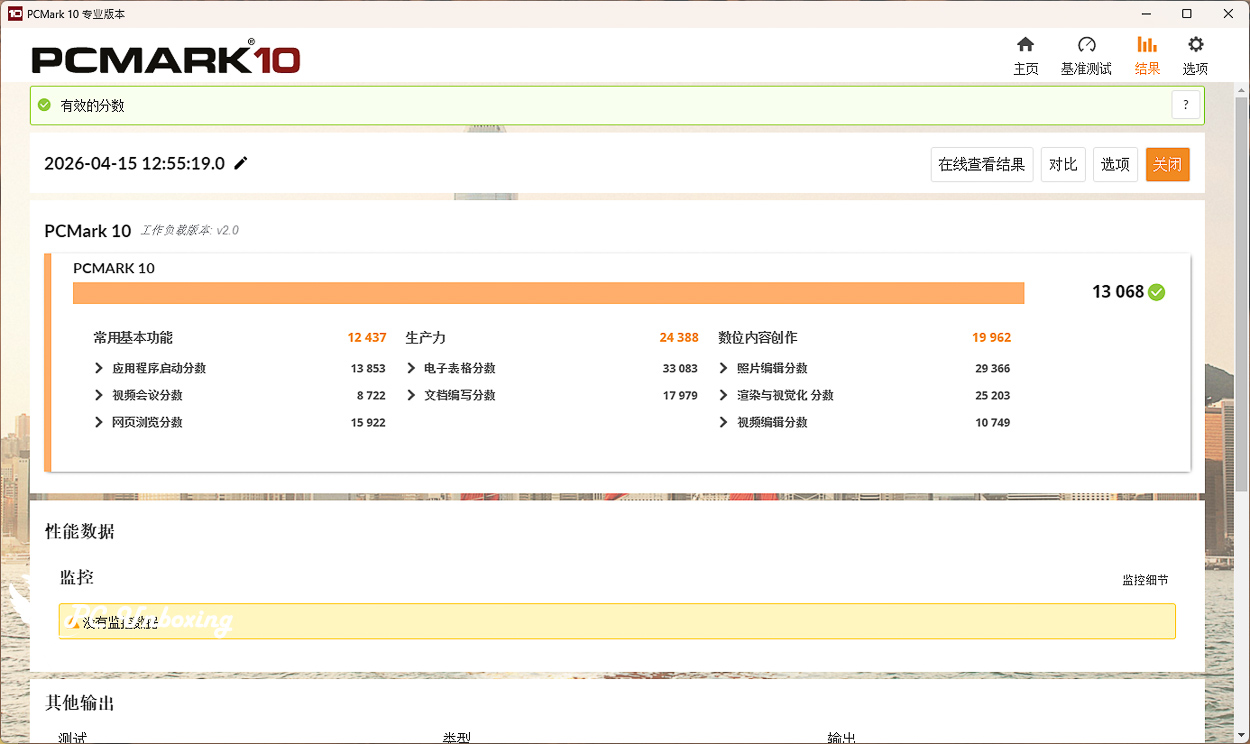
△ PCMark 10 test.
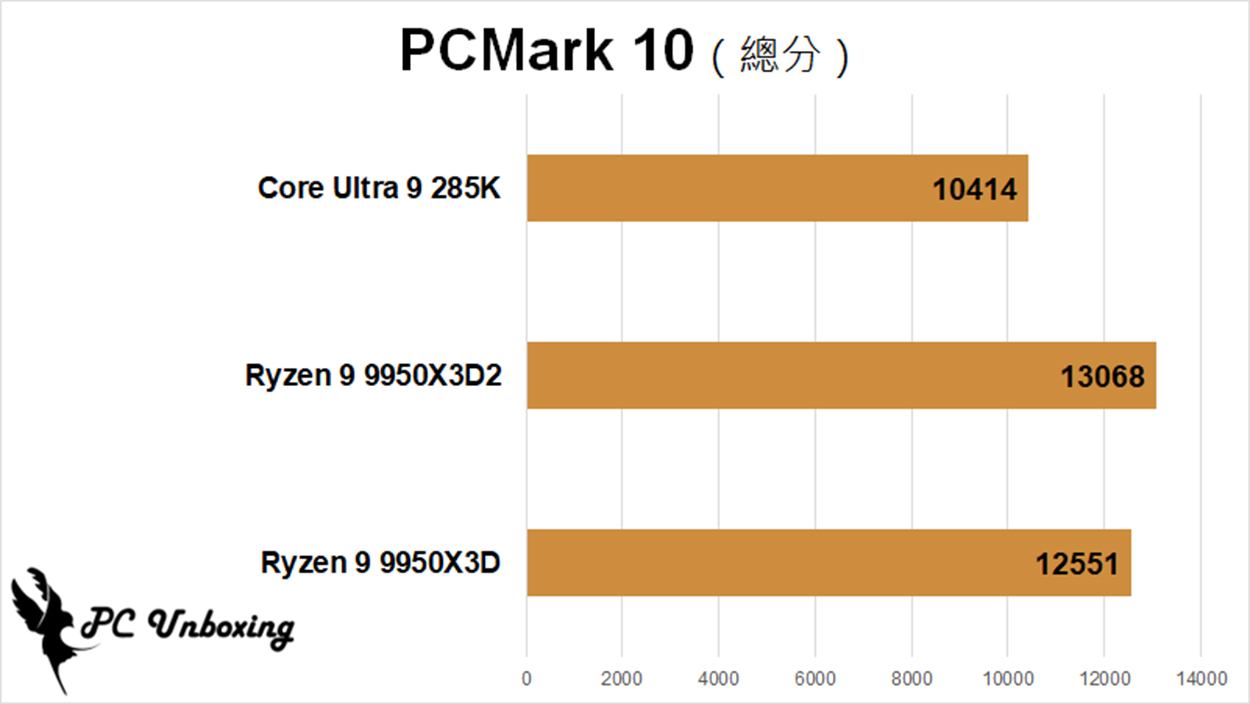
△ PCMark 10 test comparison chart.
AMD Ryzen 9 9950X3D2 3DMark Tests: Gaming Performance and CPU Performance Analysis
Next up, the 3DMark series, one of the most benchmarks for gaming scores, was used to compare the theoretical results of the same graphics platform with different processors through a series of tests with different picture quality and different GPU APIs.
3DMark CPU Profile This test will test the performance of MAX, 16, 8, 4, 2, 1 threads respectively, while the performance of 16 threads and above is more for 3D rendering or audio/video professional work, and most of the mainstream DirectX 12 game performance can refer to the score of 8 threads, while the score of 4 and 2 threads are related to the old games developed with DirectX 9.
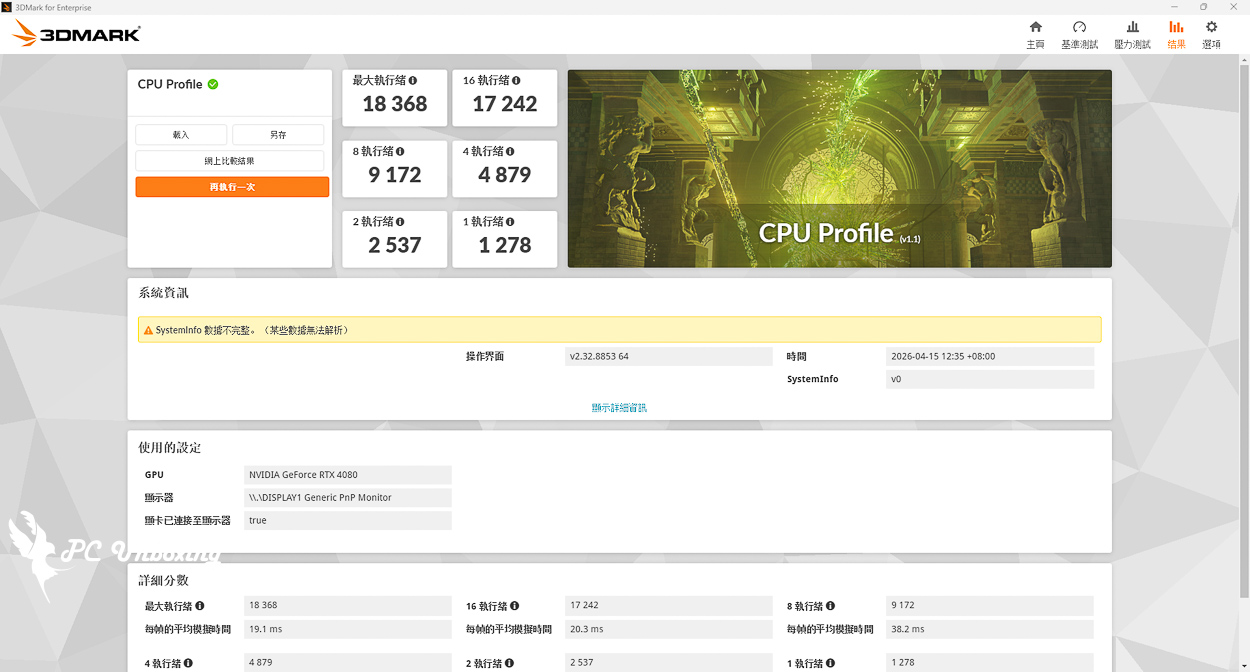
△ 3DMark CPU Profile.
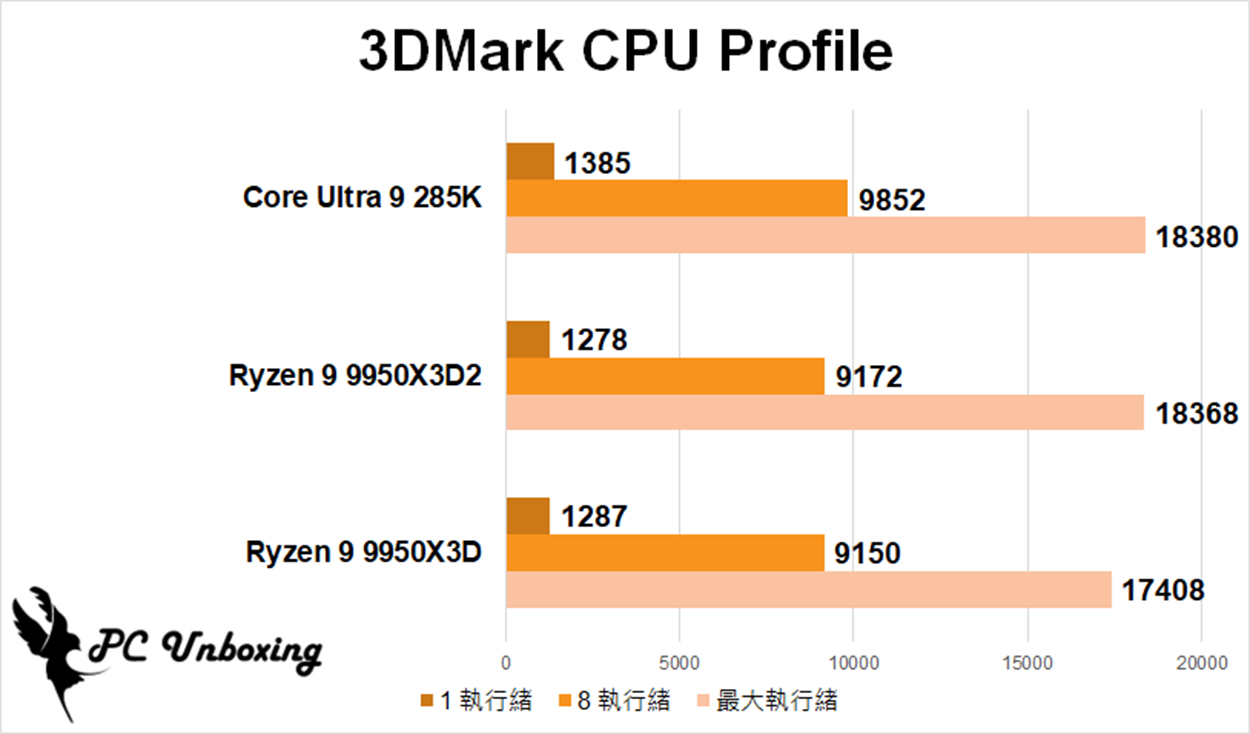
△ 3DMark CPU Profile comparison chart.
In addition, the author has also used the commonly used game performance simulation test 3DMark Fire Strike、3DMark Time SpyThe two programs are Fire Strike, which represents the 1080p quality DirectX11 GPU API situational game simulation test, and Time Spy, which represents the 1440p quality DirectX 12 GPU API situational game simulation test.
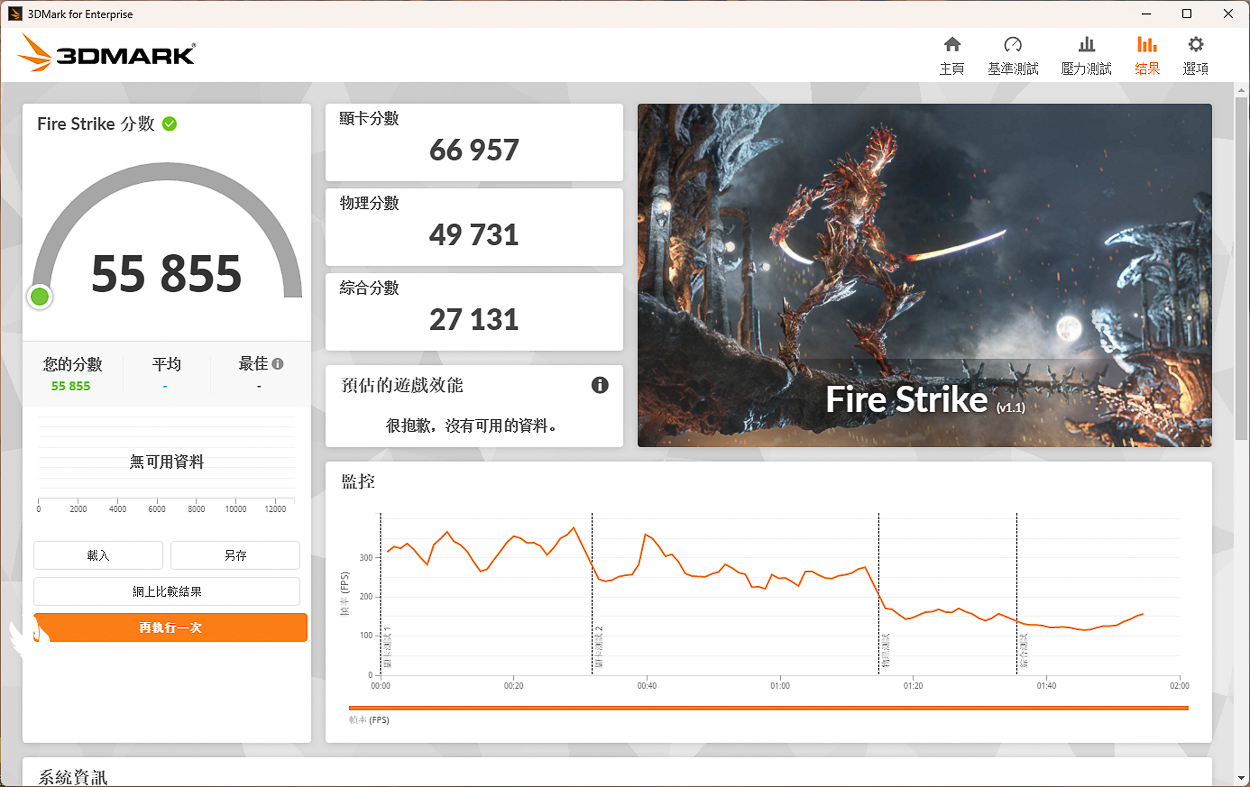
△ 3DMark Fire Strike.
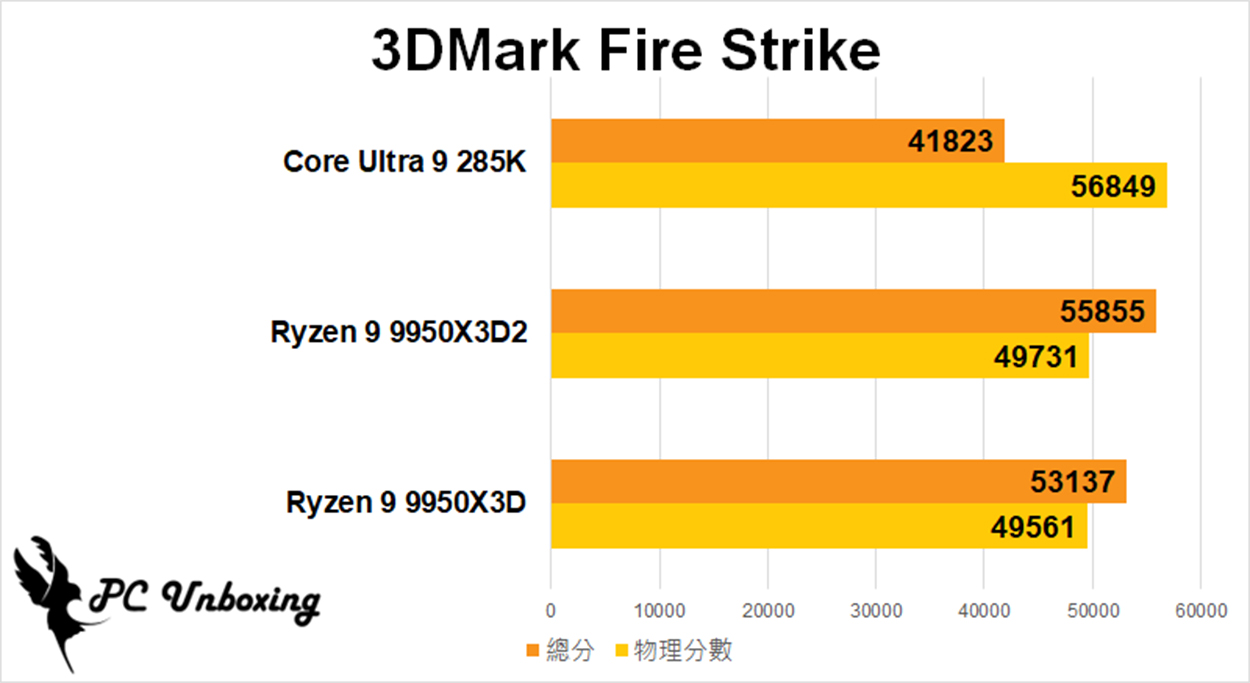
△ 3DMark Fire Strike comparison chart.
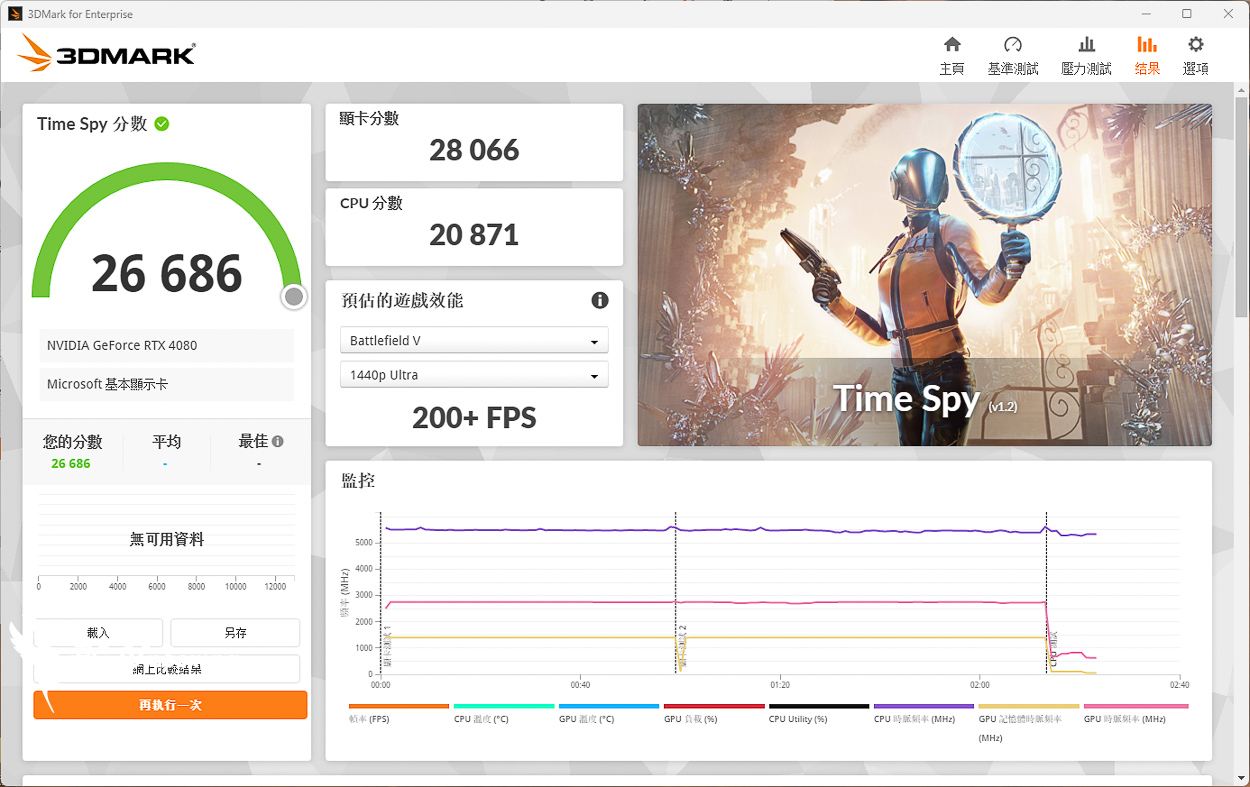
△ 3DMark Time Spy.
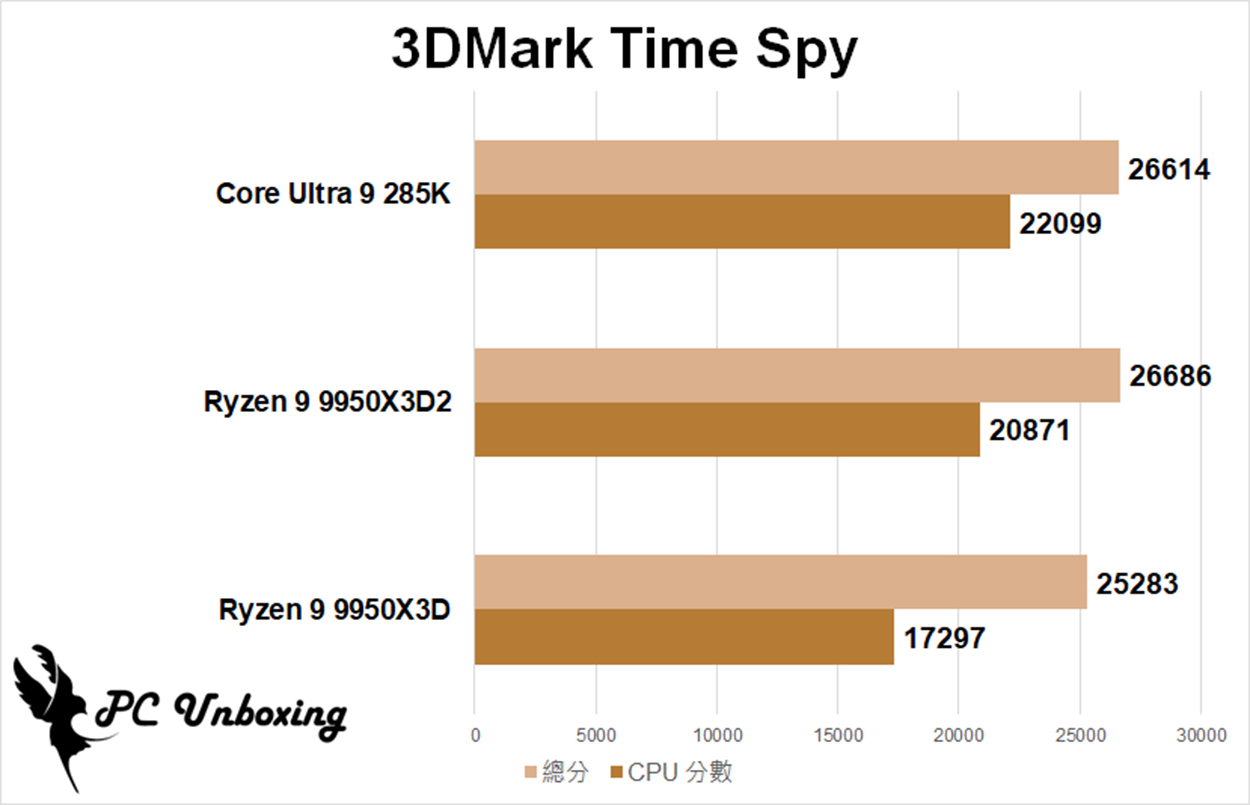
△ 3DMark Time Spy comparison chart.
AMD Ryzen 9 9950X3D2 MMORPG Gaming Test: FF14, WILD WILD Performance
MMORPG Massively Multiplayer Online Role-Playing Game has chosen theFF14_Final Fantasy XIV_ and _Final Fantasy XIV_ and _Final Fantasy XIV_ and _Final Fantasy XIV_.Monster Hunter WildernessMonster Hunter Wilds" two popular games for performance testing, and use their respective "FINAL FANTASY XIV: Dawntrail Official Benchmark" and "Monster Hunter Wilds Benchmark" official performance test tool for the scores, and will be The texture quality was set to the "Highest" setting in the game, and the resolution was set to Full HD 1920×1080.
The first is the "The Race to the Top", which is due to be launched in about 2024.FF14 Golden Legacy_FINAL FANTASY XIV: Dawntrail Official Benchmark", with the texture quality set to "Highest Quality" and NVIDIA DLSS (Deep Learning Super Sampling) enabled.
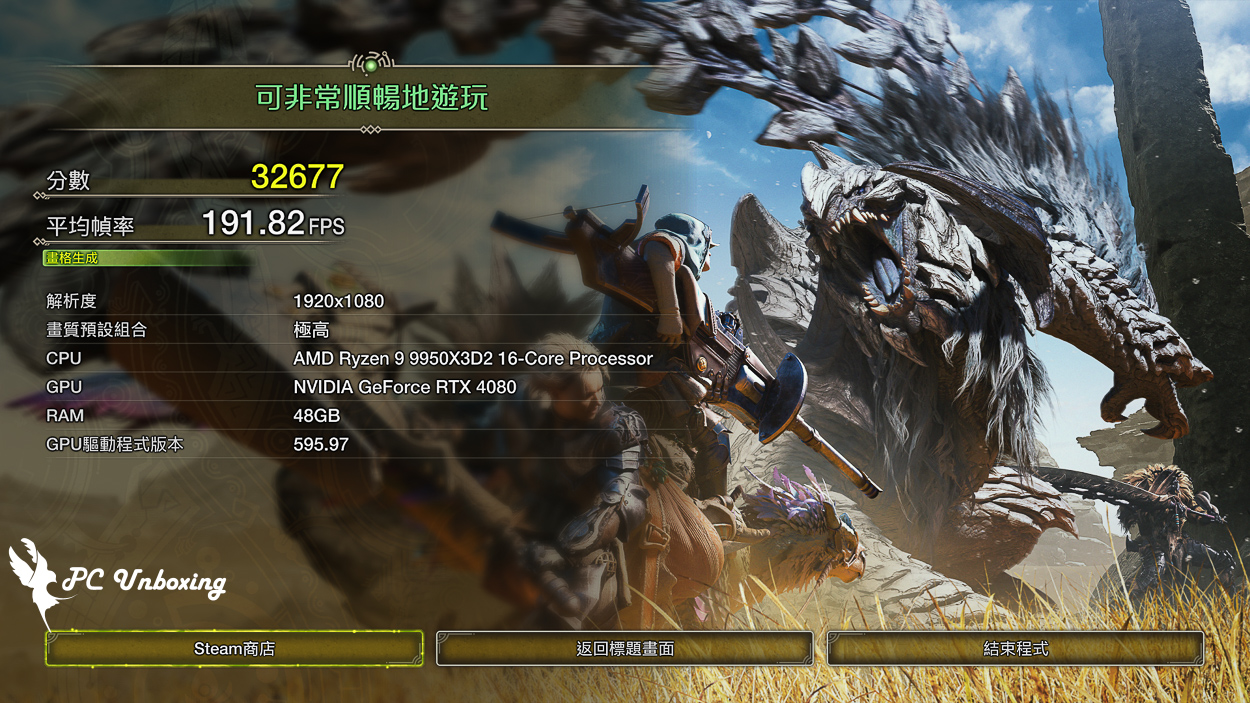
The second paragraph of theMonster Hunter WildernessMonster Hunter Wilds Benchmark is a PC performance test software released in 2025, with a preset combination of "very high" quality, upscaling (super resolution technology) to NVIDIA DLSS quality priority, and frame generation on.
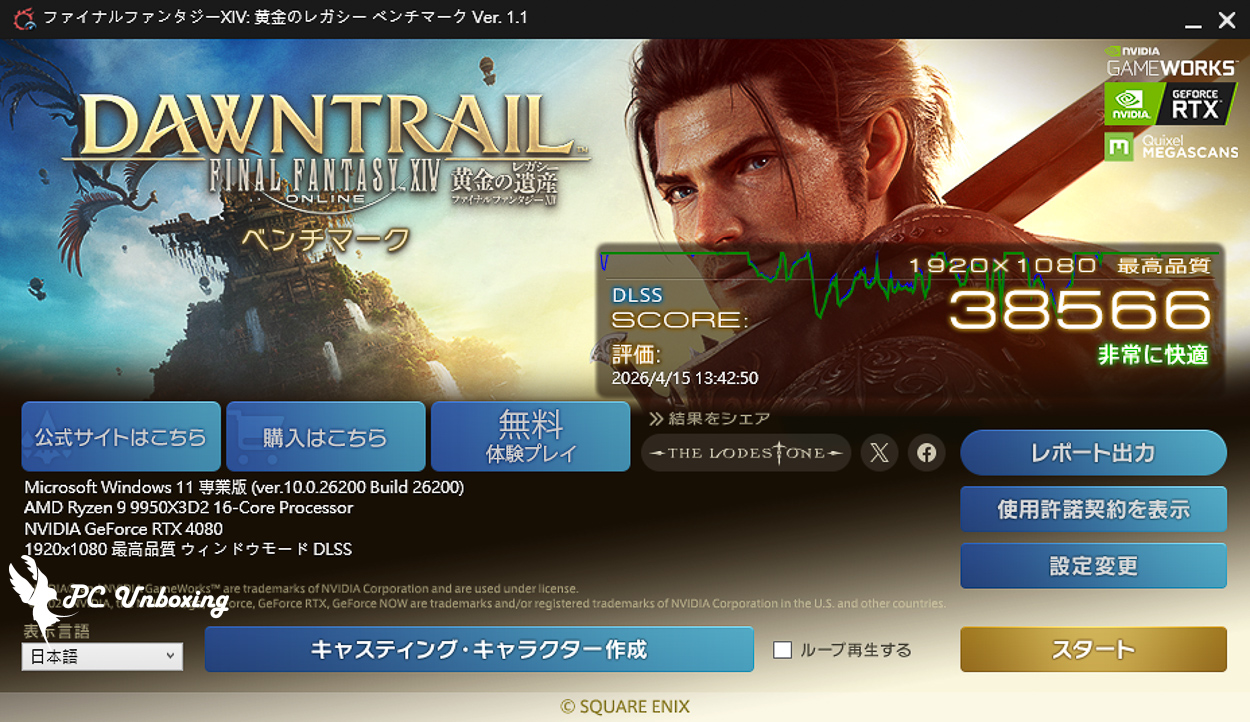
△ TheFF14 Golden Legacy_FINAL FANTASY XIV: Dawntrail Official Benchmark_.
Intel Core Ultra 9 285K.Monster Hunter Wilderness_Monster Hunter Wilds Benchmark_.
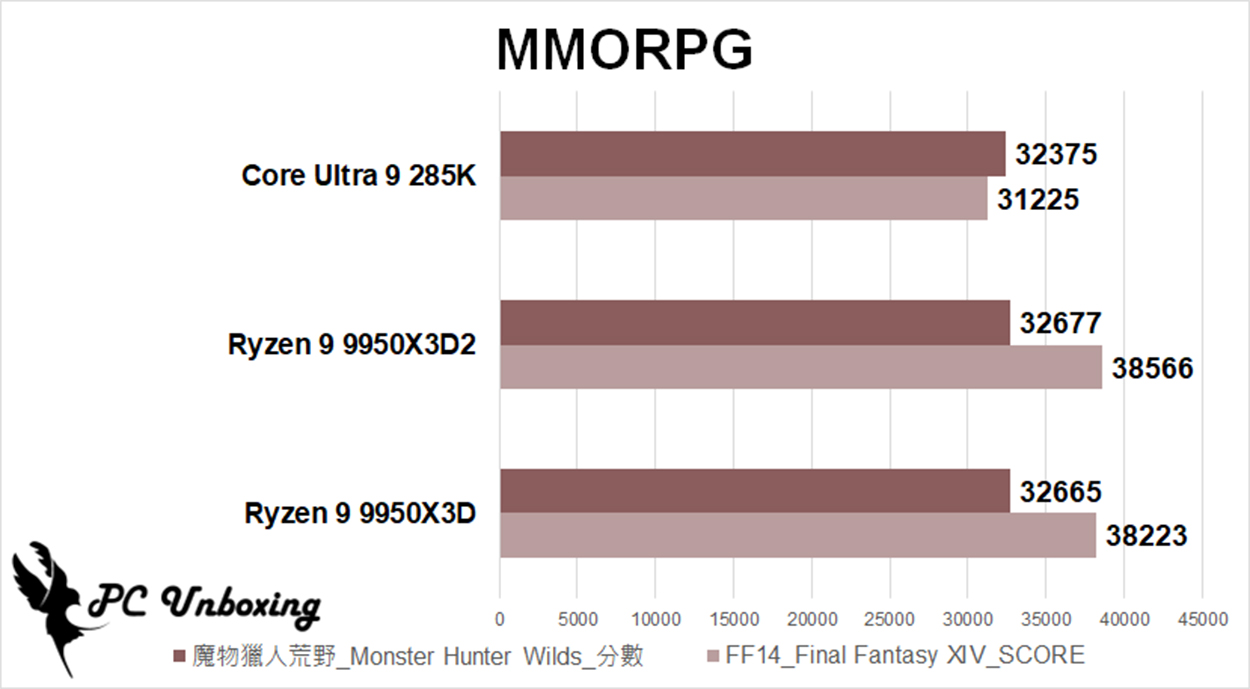
MMORPG comparison chart.
AMD Ryzen 9 9950X3D2 FPS Gaming Performance Test: Forever, R6, Apex Frame Rate Performance
Three iconic games have been selected for testing in the FPS gaming category.Rainbow Six: Siege X_Tom Clancy's Rainbow Six Siege X, Thethere is no room for eternity_NARAKA: BLADEPOINT and theApex LegendsThe "APEX" setting will be set to the "Highest" setting in the game, and APEX will manually input the code up to 300 fps due to the game's default frame rate limit of 144 fps.
With a standardized resolution of Full HD 1920×1080 to allow for side-by-side comparisons of processor performance under stress, average (AVG) fps and 1% Low fps were collected through NVIDIA GeForce's free FrameView software.
《there is no room for eternity__NARAKA: BLADEPOINT: DirectX 11, NVIDIA DLSS Quality, Overall Quality_Extremely High
《Apex Legends": DirectX 12, NVIDIA Reflex Enablement + Enhancements, TEXTURE STREAMING BUDGET_ENGINEERED (8GB VRAM)
《Rainbow Six: Siege XTom Clancy's Rainbow Six Siege X: The quality of the whole thing is super high.
Of the three FPS-type gaming games, the other two are all about collecting frames on the range, except for Tom Clancy's Rainbow Six Siege X, which has a built-in performance test.
- Average fps: Record the number of frames generated during a test play session and divide by the total recording time to get the average value.
- 1% Low fpsThe value of the 1% part of the frame that represents the longest frame generation time (Frametime) during the test is calculated as the average value, the closer the value is to the measured average fps, it means that the game does not have any significant frame dropping problem, in other words 1% Low fps is the low frame rate fluctuation situation.
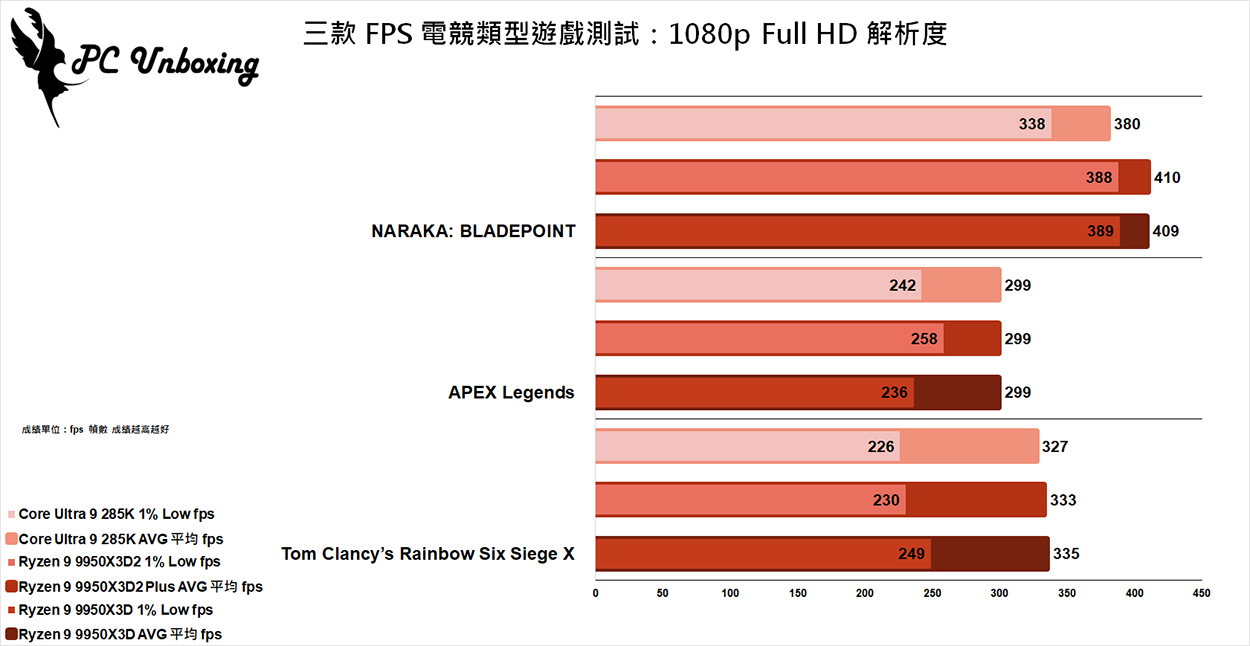
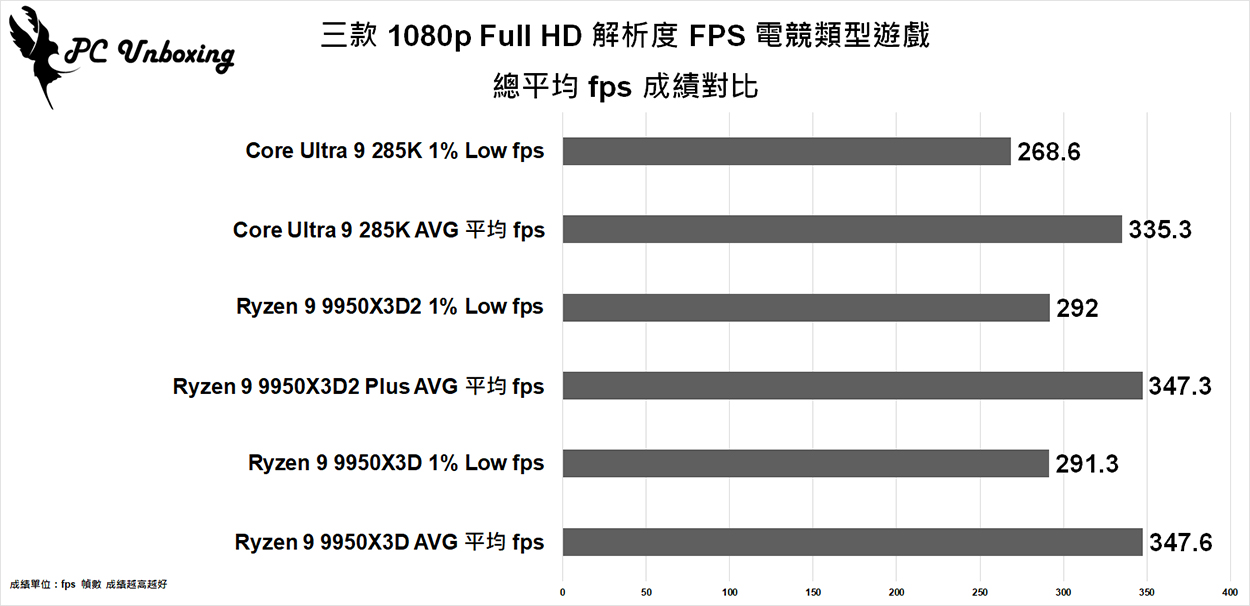
△ Three FPS-type gaming tests: highest texture effects, FHD 1920×1080 resolution.
AMD Ryzen 9 9950X3D2 Dual Edition AAA Game Performance Test|10 3A Games Frame Rate Performance
To test the AAA genre, which emphasizes on the experience of graphic performance and storytelling, the author chose to play "The Battle of the Birds", which is the first game in the AAA genre.The Witcher 3: Wild Hunt_The Witcher 3: Wild Hunt, TheThe Last Man Standing Part 1_ The Last of Us Part I, _Fascination of the human-machine network_PRAGMATA SKETCHBOOK - DEMO_, theSpider-Man: Miles Morath._Spider-Man: Miles Morales, TheKingdom Come: Redemption II_Kingdom Come: Deliverance II, TheGhosts of Tsushima Warriors_Ghost of Tsushima》、《Cyberpunk 2077》、《Kurokami Dialog: Goku_Black Myth: Wukong, TheHorizon: The Western Sanctuary_ Horizon Forbidden West, _Brothers of the Four Seas: The Definitive Edition_Mafia: Definitive Edition" and ten other 3A masterpieces were tested.
《The Witcher 3: Wild Hunt_The Witcher 3: Wild Hunt: DirectX 12, Preset Image_Light Following:Extreme, NVIDIA Reflex Low Latency_On
《The Last Man Standing Part 1_The Last of Us Part I_: Image Preset_Ultra High
《Fascination of the human-machine network__PRAGMATA SKETCHBOOK - DEMO》:Light Tracking_On
《Spider-Man: Miles Morath._Spider-Man: Miles Morales: NVIDIA Reflex Low Delay_Open, Boost Mode_DLSS, Graphics Like Preset_Very High
《Kingdom Come: Redemption IIKingdom Come: Deliverance II: Overall video quality is _very_ high!
《Ghosts of Tsushima Warriors_Ghost of Tsushima": Preset_Very High, Boost Mode_DLSS, NVIDIA Reflex Low Latency_On
《Cyberpunk 2077": Quick Preset_Light Tracking: Max.
《Kurokami Dialog: GokuBlack Myth: Wukong: DLSS/DLAA, Frame Generator_on, Panoramic Light Tracking_on/Ultra High, Picture Class_Video Class
《Horizon: The Western SanctuaryHorizon Forbidden West: DLSS image quality, screen presets, very high quality
《Brothers of the Four Seas: The Definitive Edition_Mafia: Definitive Edition: Overall Quality Preset_Best
Considering the fact that most gamers pursue the most beautiful graphics performance rather than the highest frame rate performance when playing 3A games, the author also used the "highest" built-in texture effect settings in the AAA type of game testing and turned off vertical synchronization to avoid frame rate limitation, and the frame rate was also collected using the Software Average of Recorded Grosses (AVG) as well as the 1% Low fps.
- Average fps: Record the number of frames generated during a test play session and divide by the total recording time to get the average value.
- 1% Low fpsThe 1% part of the frame value that represents the longest frame generation time (Frametime) during the test is calculated as the average value, the closer the value is to the measured average fps, it means that the game does not have a significant frame drop problem, in other words, 1% Low fps is the fluctuation of the low frame rate.
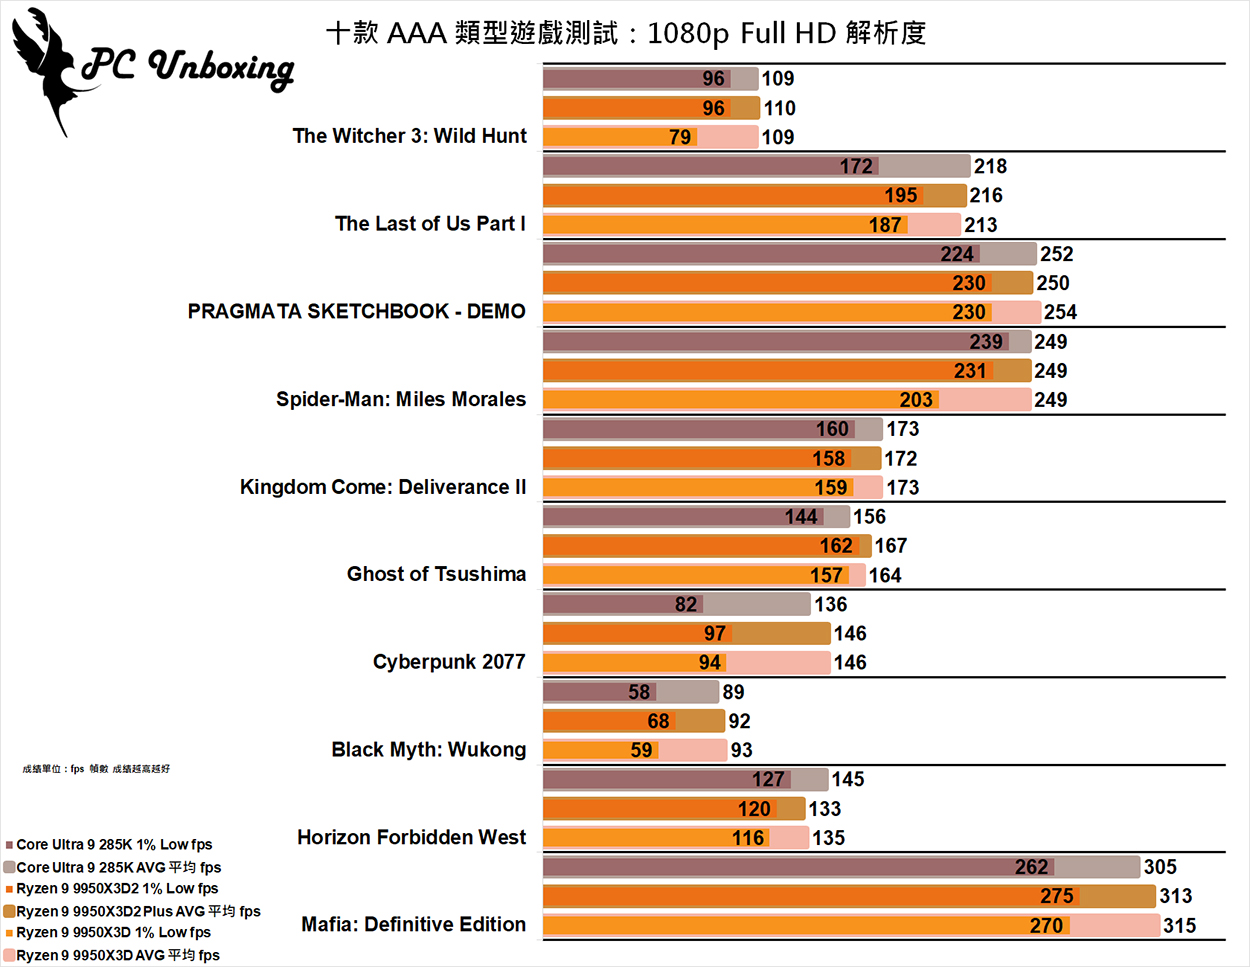
△ Ten AAA games tested: highest texture effects, FHD 1920×1080 resolution.
AMD Ryzen 9 9950X3D2 Temperature and Power Test: Thermal Performance and Power Consumption Analysis
The test platform was set up on an indoor barebones test rig in a sealed room at 24 °C. The ambient temperature in a normal room is difficult to control, so it is only used for reference.
The author used Cinebench 2026 CPU (Multiple Thread), AIDA64 FPU, AIDA64 CPU, theKurokami Dialog: GokuBlack Myth: Wukong", and the data was collected using HWiNFO64 to collect and record the maximum temperature, and the information was converted into graphs for players' reference.
- AIDA64 FPU_30 Minute
- AIDA64 CPU_30 Minute
- Black Myth: Wukong 1920 x 1080(FHD)_Performance Test Tool 1 Round
- Cinebench 2026 CPU (Multiple Thread)_1 Round
- CPU temperature is measured by the diode in the slot to measure the internal (core) or external (case) temperature, but there is no way to know exactly whether it is the internal or external temperature that is measured, and most monitoring software uses this item to display the CPU temperature.
- CPU (Tctl/Tdie) temperature is the actual maximum temperature of the CPU sensor in the chip.
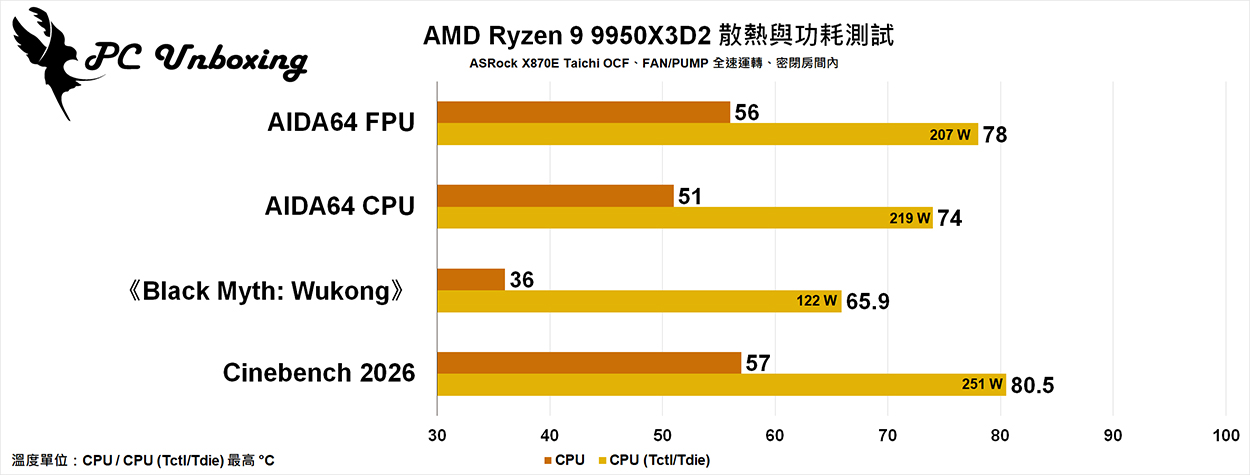
△ AMD Ryzen 9 9950X3D2_Cooling performance test and power consumption performance.
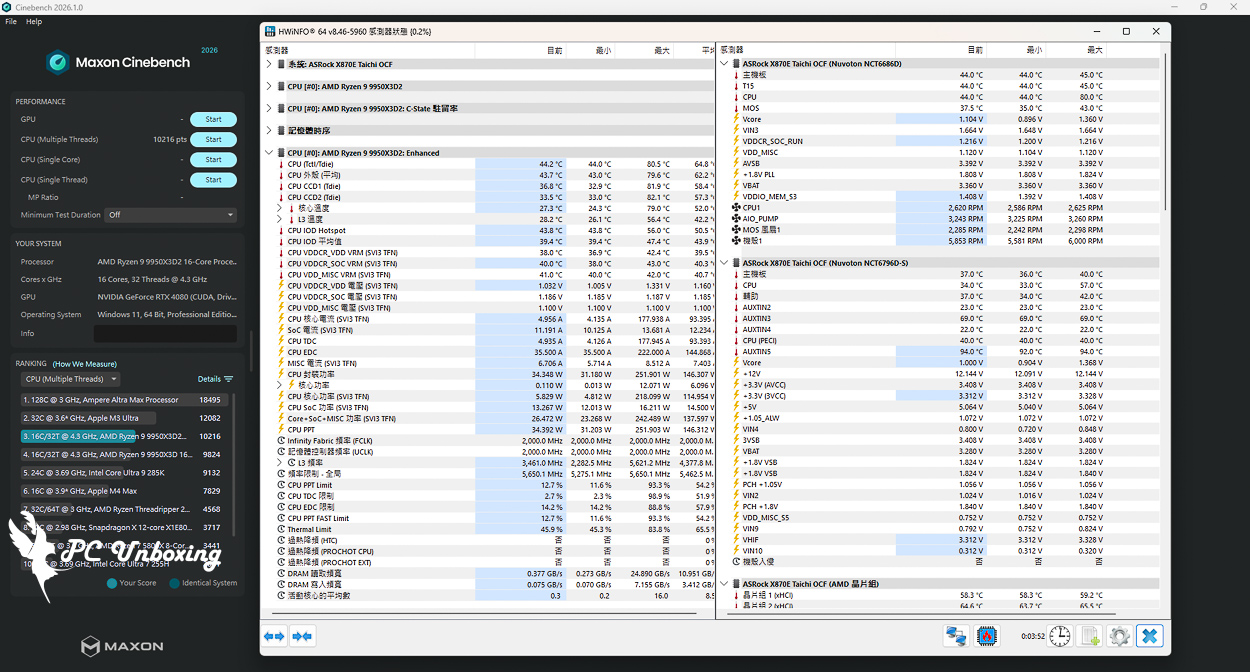
△ Cinebench 2026 CPU (Multiple Thread)_1 Round temperature measurement screenshot.
AMD Ryzen 9 9950X3D2 Review Summary: Is it worth the upgrade? Who Should Buy
AMD Ryzen 9 9950X3D2 Dual Edition First of all, in terms of the suggested price, it's better than the original Ryzen 9 9950X3D The Zen 5 is also $200 more expensive, and Taiwan's price tag of $30,000 or more is too high. Although the specification of the Zen 5 has multiple cores and a 192 MB L3 cache with dual 3D V-Cache, which is a total killer for simulation games such as Metropolis: Skylanders II and can be considered as the Zen 5's ultimate answer to the questionnaire, it does not have a lot of significance to the average consumer and the pricing is too extravagant for the rich and heavy simulation gamers to consider. For the average consumer, it is not very meaningful and the pricing is too extravagant, which is suitable for those who want to go straight to the top and those who are heavy gamers of simulation games to consider, but I don't play simulation games, so I'm not interested in it.
From the official promotional video, you can find that AMD officials have emphasized on the professional multi-core performance enhancement, it can be seen that it is not entirely for gaming. Ryzen 7 9850X3D (R7 9850X3D) or Ryzen 7 9800X3D (R7 9800X3D).
In all of the author's professional tests, the AMD Ryzen 9 9950X3D2 Dual Edition outperforms the original version. Ryzen 9 9950X3D There's still bids. Intel Core Ultra 9 285K It's even stronger than the original in the Cinebench 2026 multi-core test. Ryzen 9 9950X3D 106.4% performance; compared to competitors Intel Core Ultra 9 285K V-Ray 6 has a performance of 110.5%, and compared to V-Ray 6, which is mentioned in the official publicity, the actual test is better than the original version. Ryzen 9 9950X3D With a performance of 105.7%.
Assuming that the official 5~13% professional performance enhancement is referenced, but with the proposed price of $200 more, the author would think that it depends on whether or not there is a need for professional work, although it is very expensive, but it is a need for work after all, but if one already owns one, the author would think that it depends on whether or not there is a need for professional work. Ryzen 9 9950X3D I don't think there is much need for an upgrade.
As for the cooler, AMD Ryzen 9 9950X3D2 has a TDP (Thermal Design Power) of 200 W, and the actual test power consumption can be up to 251 W. Therefore, it is highly recommended to use the 360 water cooler with a better cooling performance to avoid performance degradation due to overheating during use.
In the multiplayer section, AMD Ryzen 9 9950X3D2 Dual Edition took the best score in the two MMORPG massively multiplayer online role-playing game scores, and in the three gaming games, it performed as well as Ryzen 9 9950X3D Basically, they're pretty much up and down, but they're all better than the competing 285K.
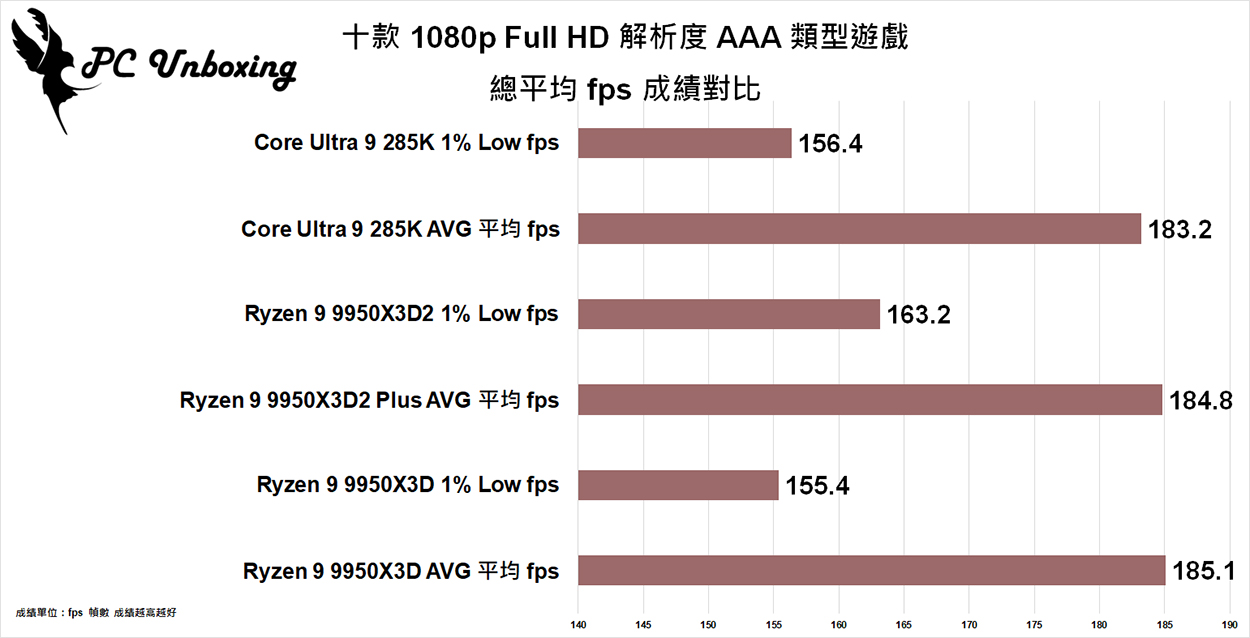
The R9 9950X3D2 has a better 1% Low fps in the 3A masterpiece test, but the average fps is not particularly impressive. Perhaps this processor is best suited for gaming in simulation games, but I'm not interested in that type of game, so I'd recommend checking out the real-world tests for related gamers.
Yun
Drinks with less than full sugar are colored water. Crossing Turbid Creek, full sugar is not a crime!
Related articles

Intel Core Ultra 200S Desktop Processor Gaming and Professional Performance Unboxing Review

Intel Core Ultra 7 270K Plus, Core Ultra 5 250K Plus Processors Unboxing: Performance, Game Scores
